

See the risk. Price the renewal. Grow the revenue.
Portfolio is one product with two halves. Signals owns the four inputs to a health score (product usage, support history, survey feedback and relationship quality) and collects all four itself, where most platforms buy three of them in. Renewals takes it from there: the quote, the contract, and the four outcomes that add up to your net revenue retention.
Nobody trusts a health score they cannot check.
Usage comes in through an analytics vendor. Support comes through a connector. Feedback lives in a separate survey tool. By the time a CSM sees the score, the working behind it is spread across four systems they cannot open. So they rebuild it by hand, and their VP asks for an update.
Five tabs open to justify one number, every time a renewal comes up.
Leadership only sees the portfolio after someone writes it up.
A churn percentage arrives with no model named and no confidence figure, so nobody can weigh it.
Five stages, start to finish.
Data arrives, gets standardised, scores against your settings, ranks against the rest of the book, and reaches whoever is allowed to act on it. No step waits for someone to write a report.
Your warehouse, your support desk, your meetings and email, and our survey engine.
Every source becomes one reading per account, per product, per day. That gives you a trend.
You set the components, weights and thresholds. Four are computed, one is a human judgement, and all five are visible next to the score.
Probability and tier, with the confidence, the contributing factors, the ARR at stake and the model version.
Work goes to the person allowed to do it. Anything above their permission level goes up a level.
A CSM works the account and their VP watches the whole book. Neither had to ask the other for anything.
Mira drafts and ranks. She never acts on her own.
Two red accounts, four days apart, one CSM.
A real morning in a demo workspace, followed at two altitudes: Jordan owns both accounts, Sam runs the function and owns none. Every screen below is a capture from the running product, in the order they were opened.
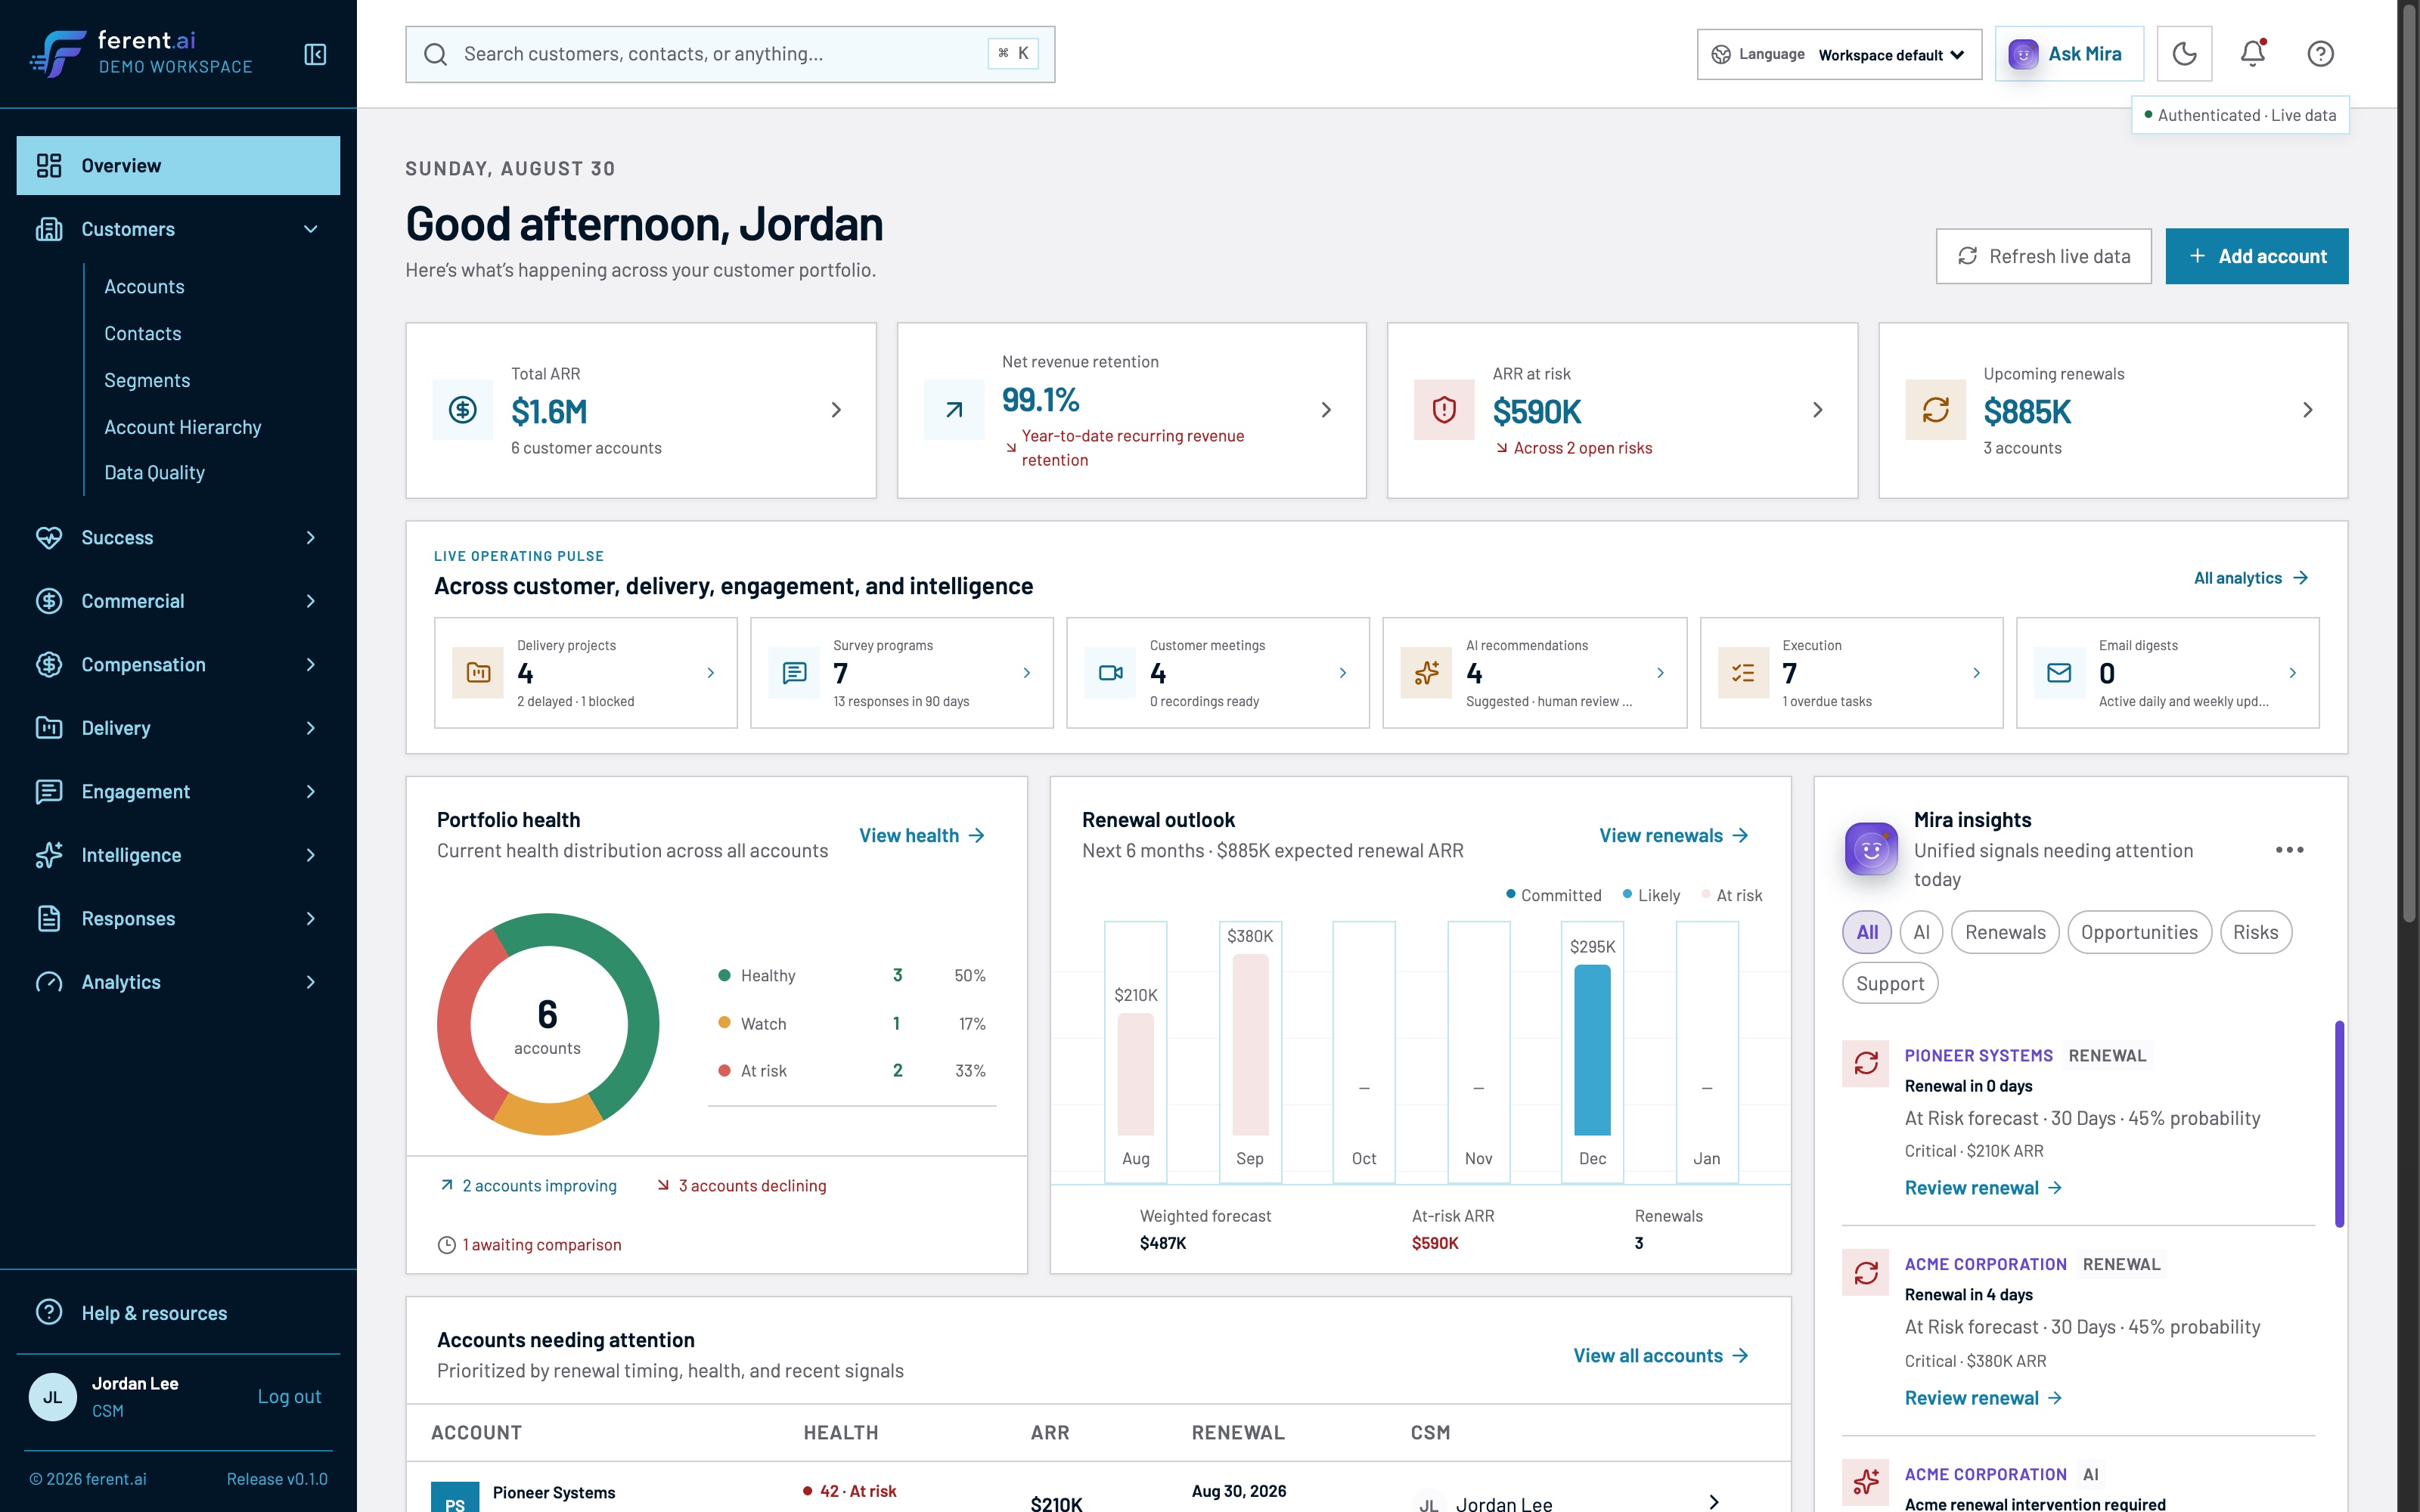
$590K at risk across two open risks, and both accounts already named. He searched for nothing.
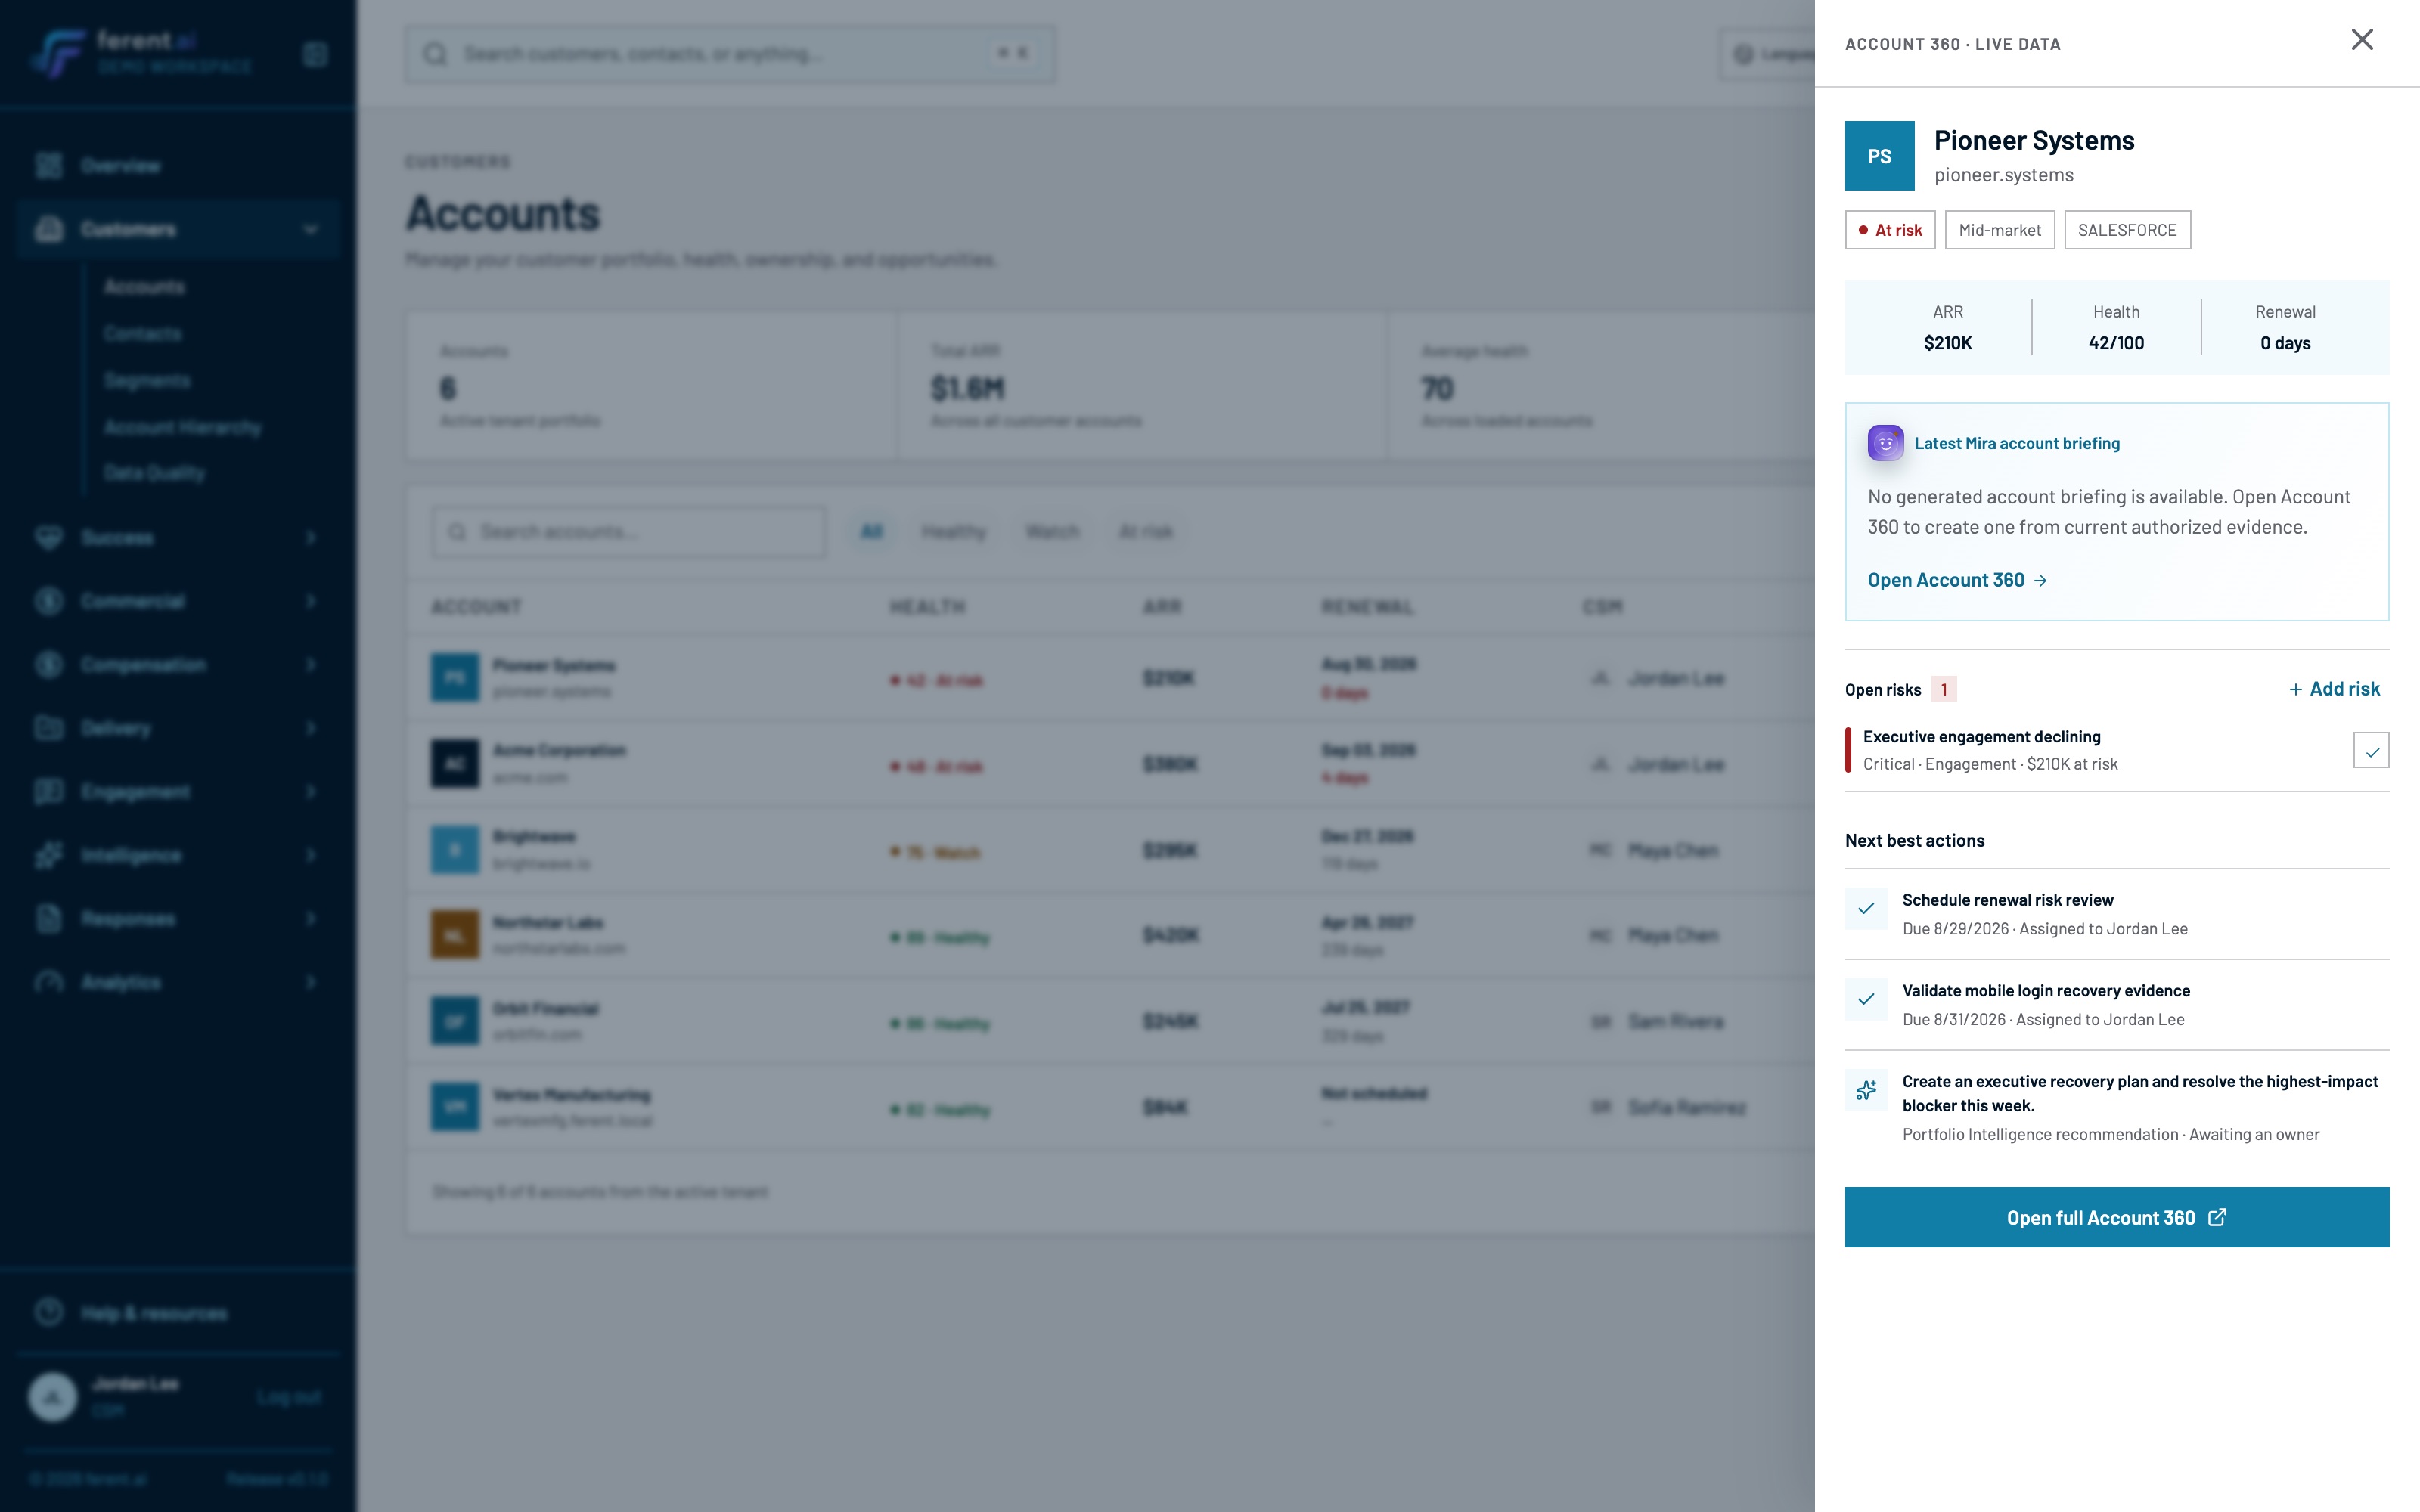
Health, revenue and renewal date on one card. One critical risk, with $210K attached to it.
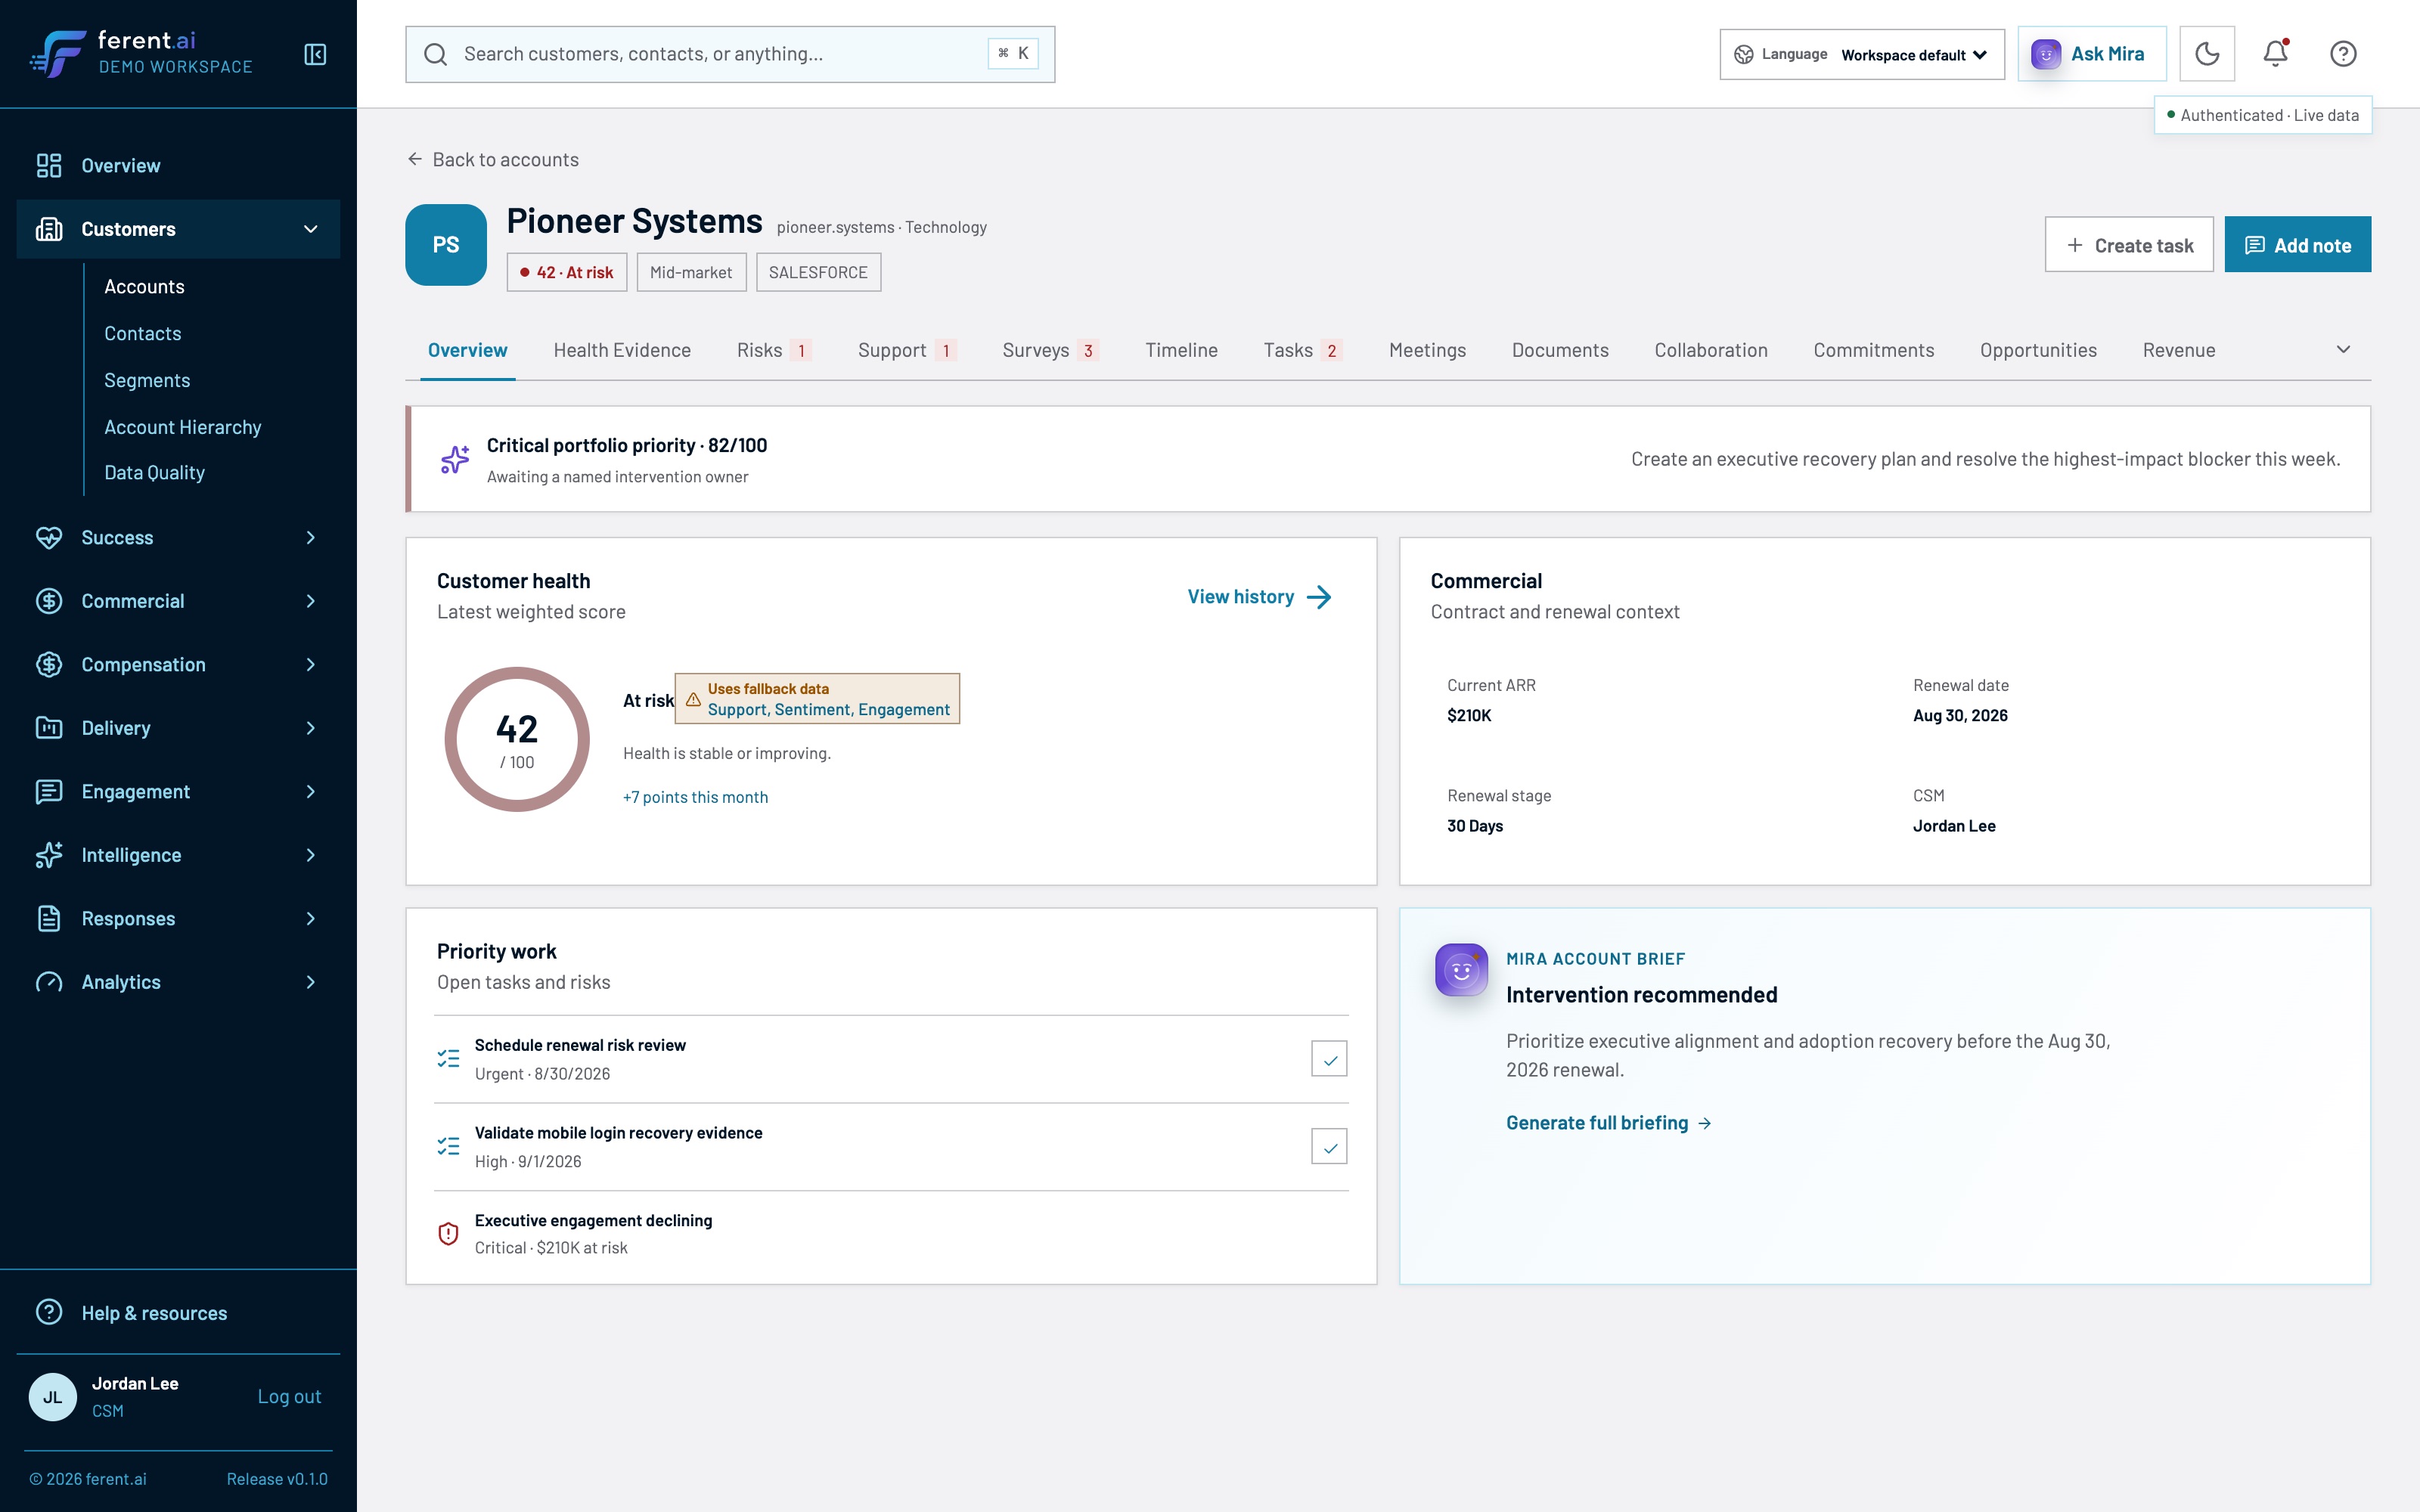
Built from what this customer licenses and what his role allows. A customer without a module never sees its tabs.
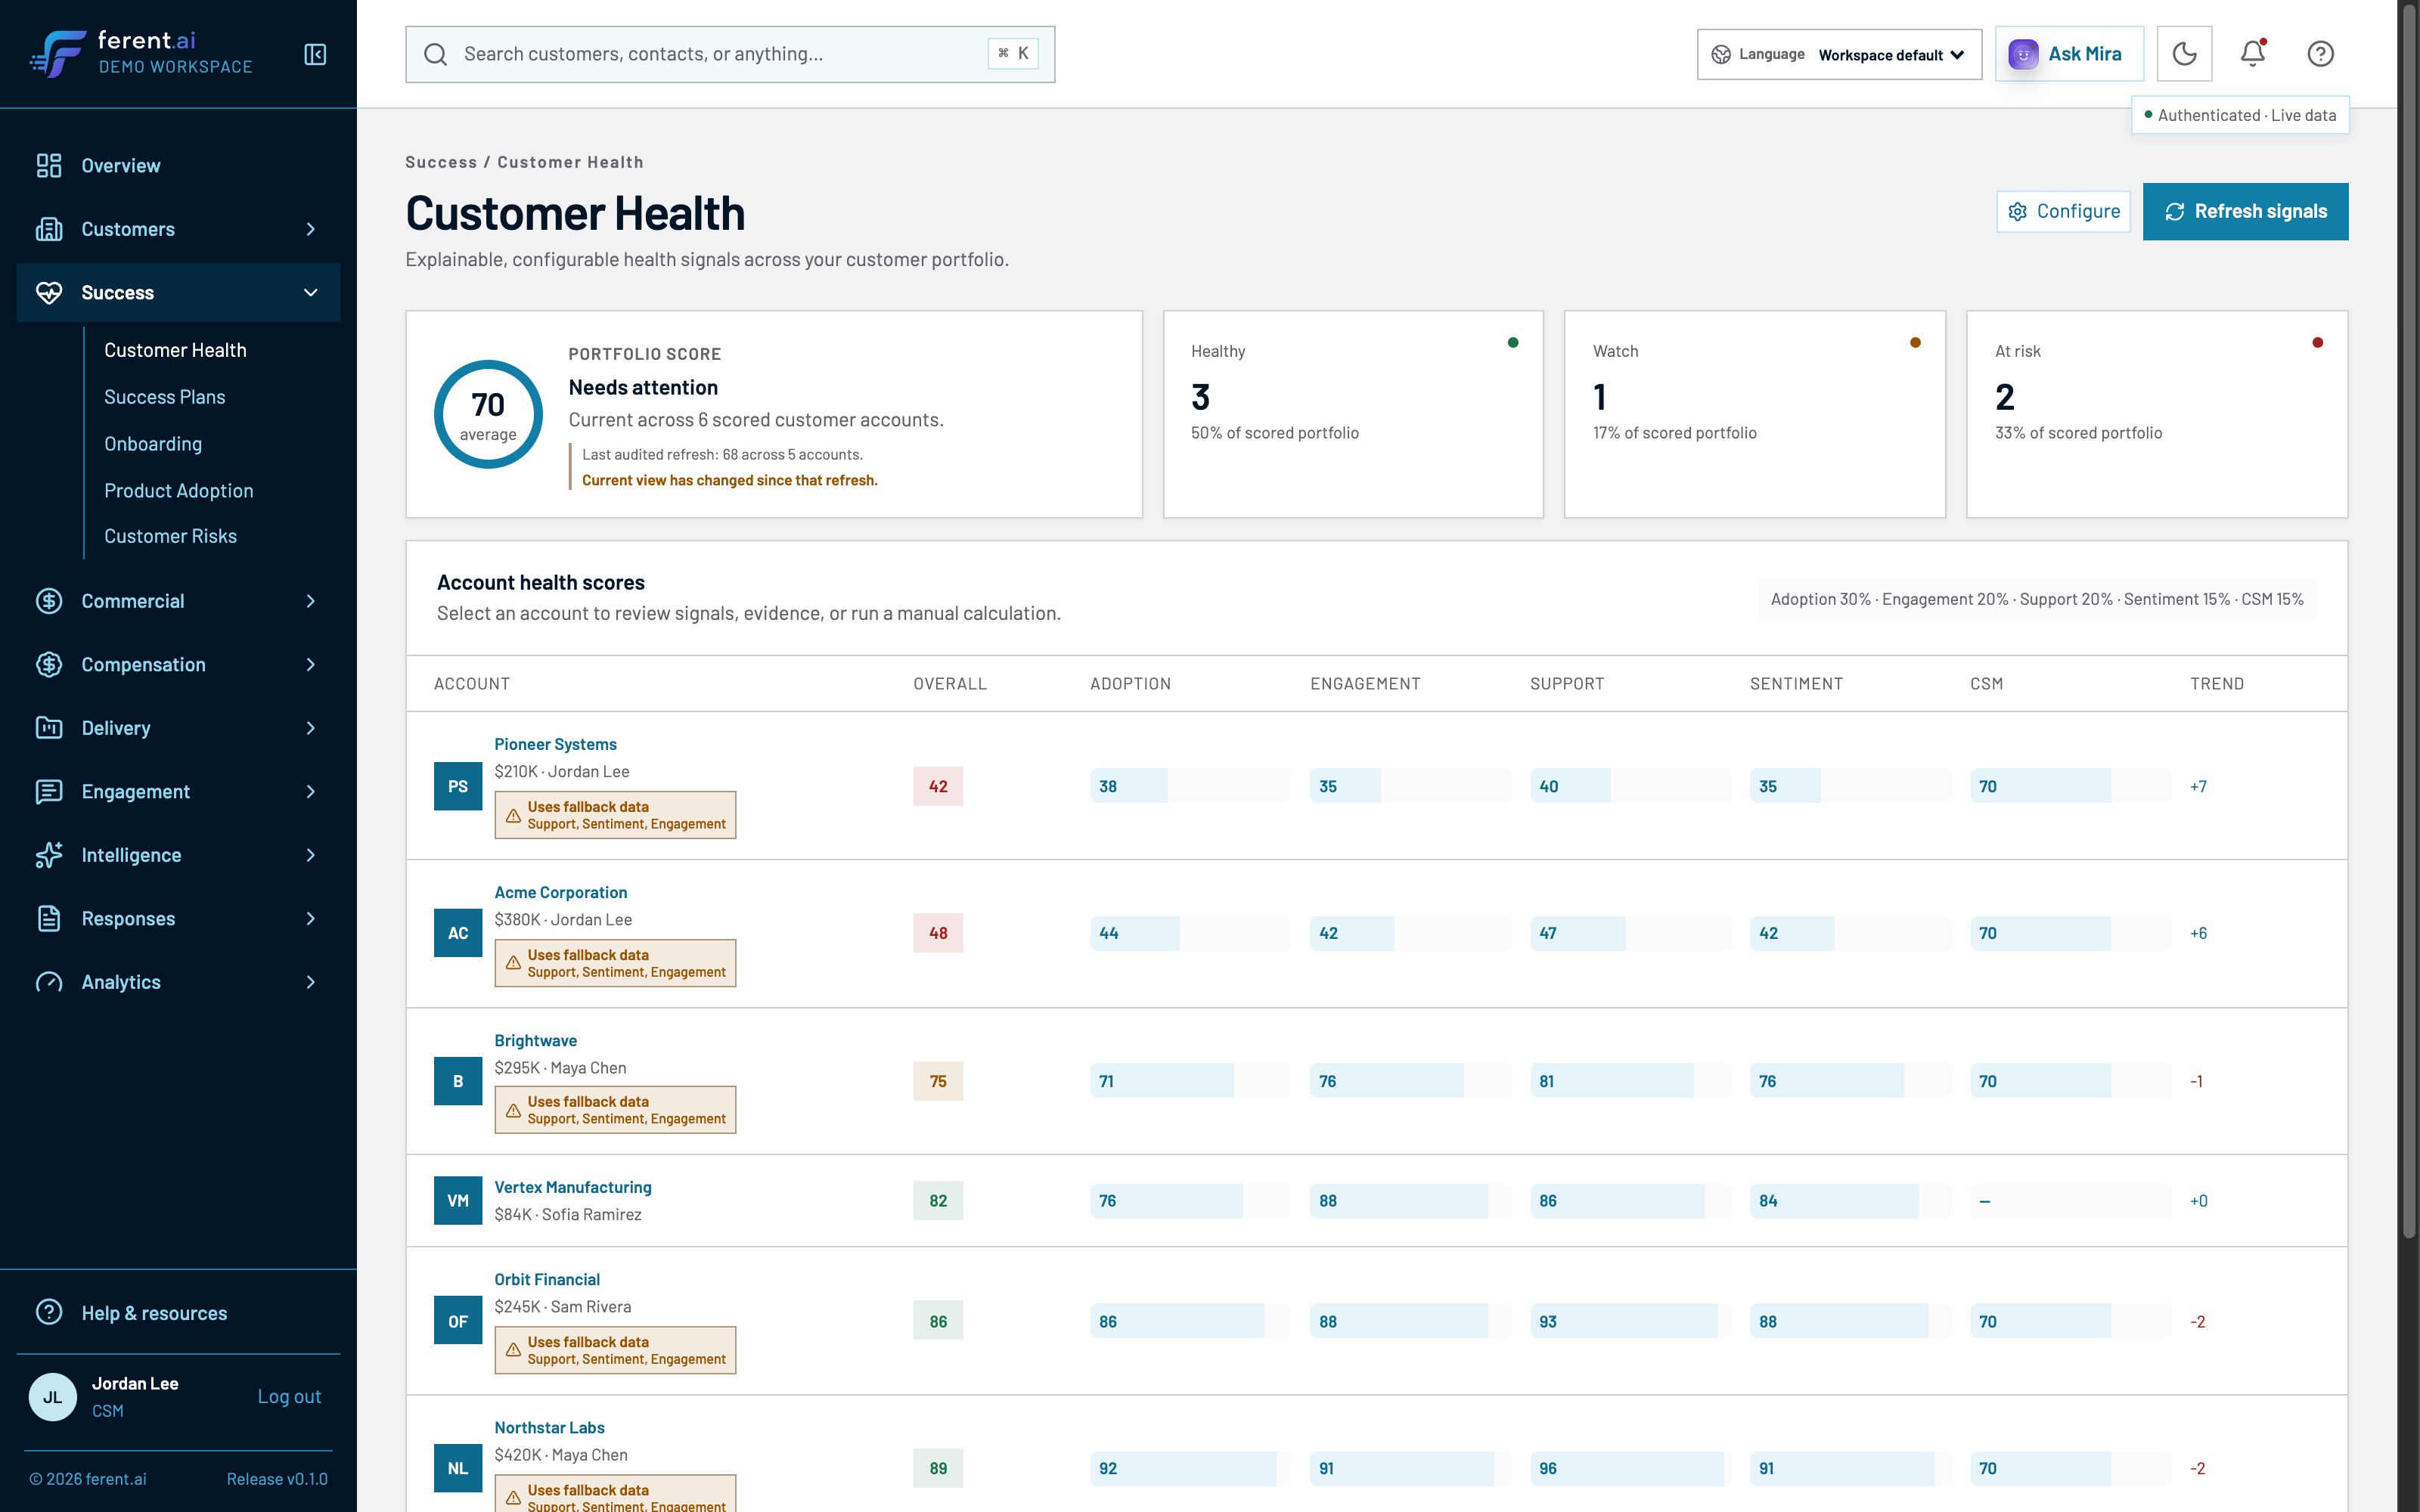
Components, weights and thresholds are the customer’s own. Four are computed; the CSM’s own read of 70 carries fifteen per cent as its own row.
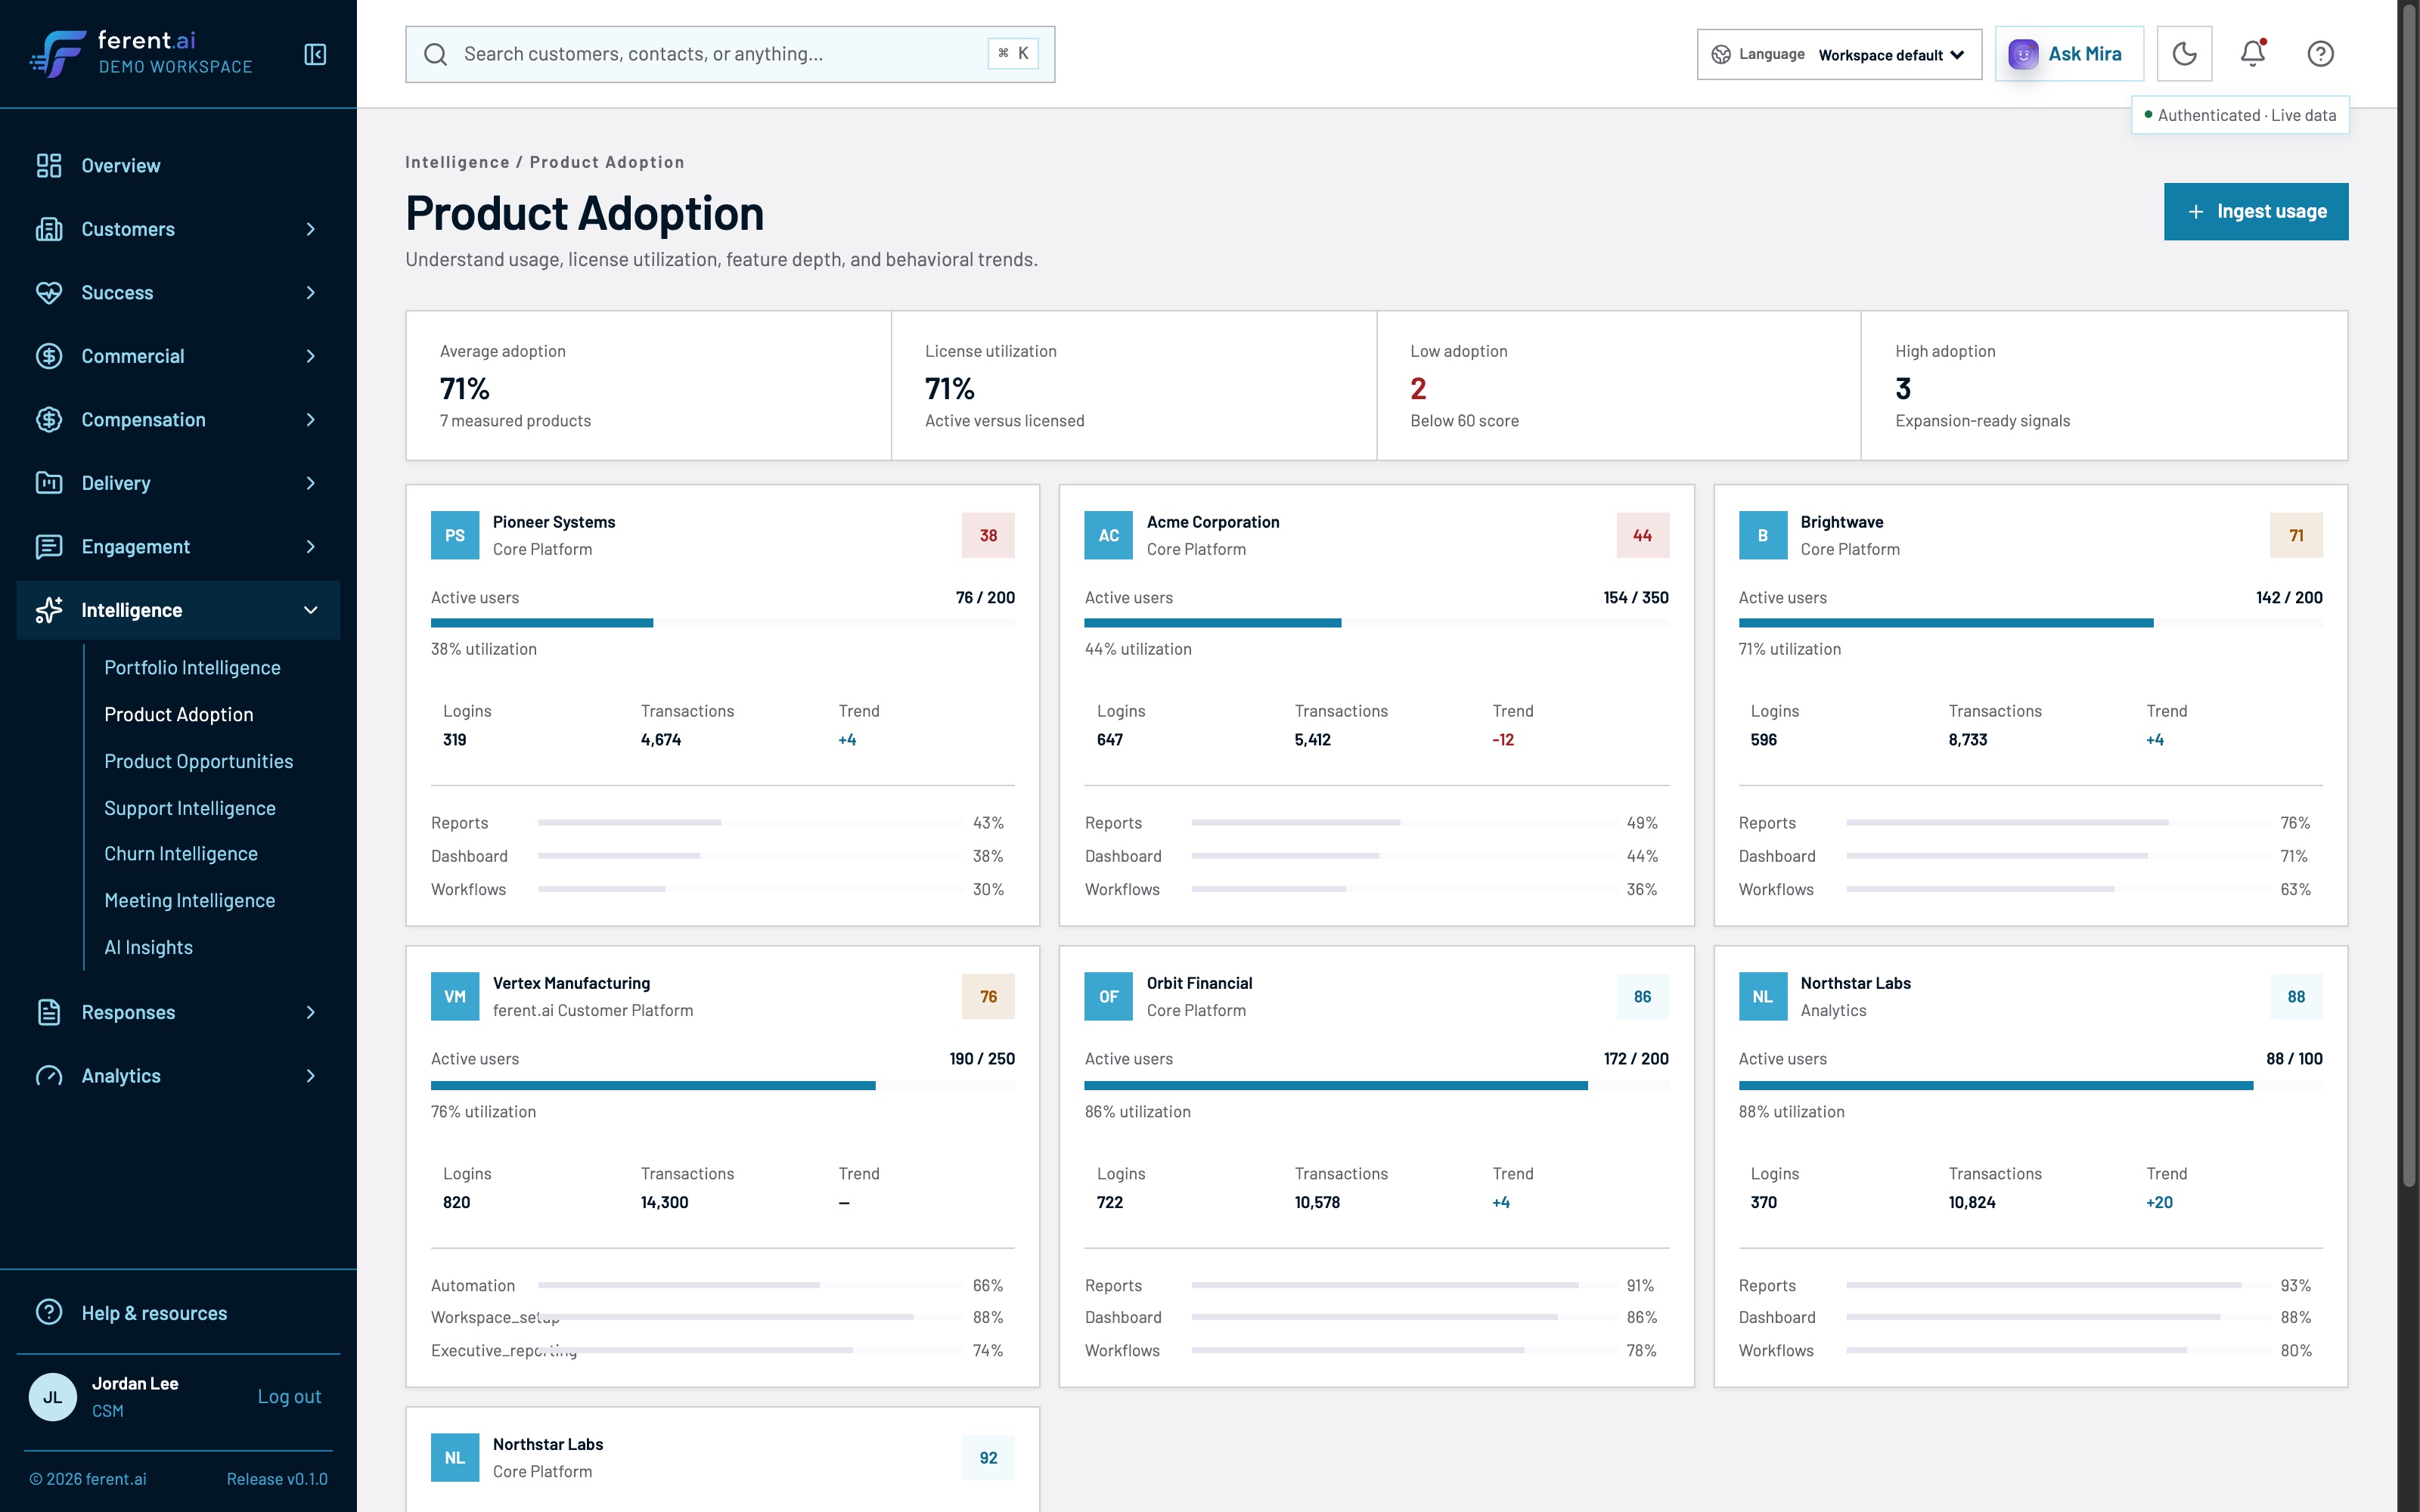
Read directly, with no analytics vendor in between. Acme down twelve points while everything else climbs.
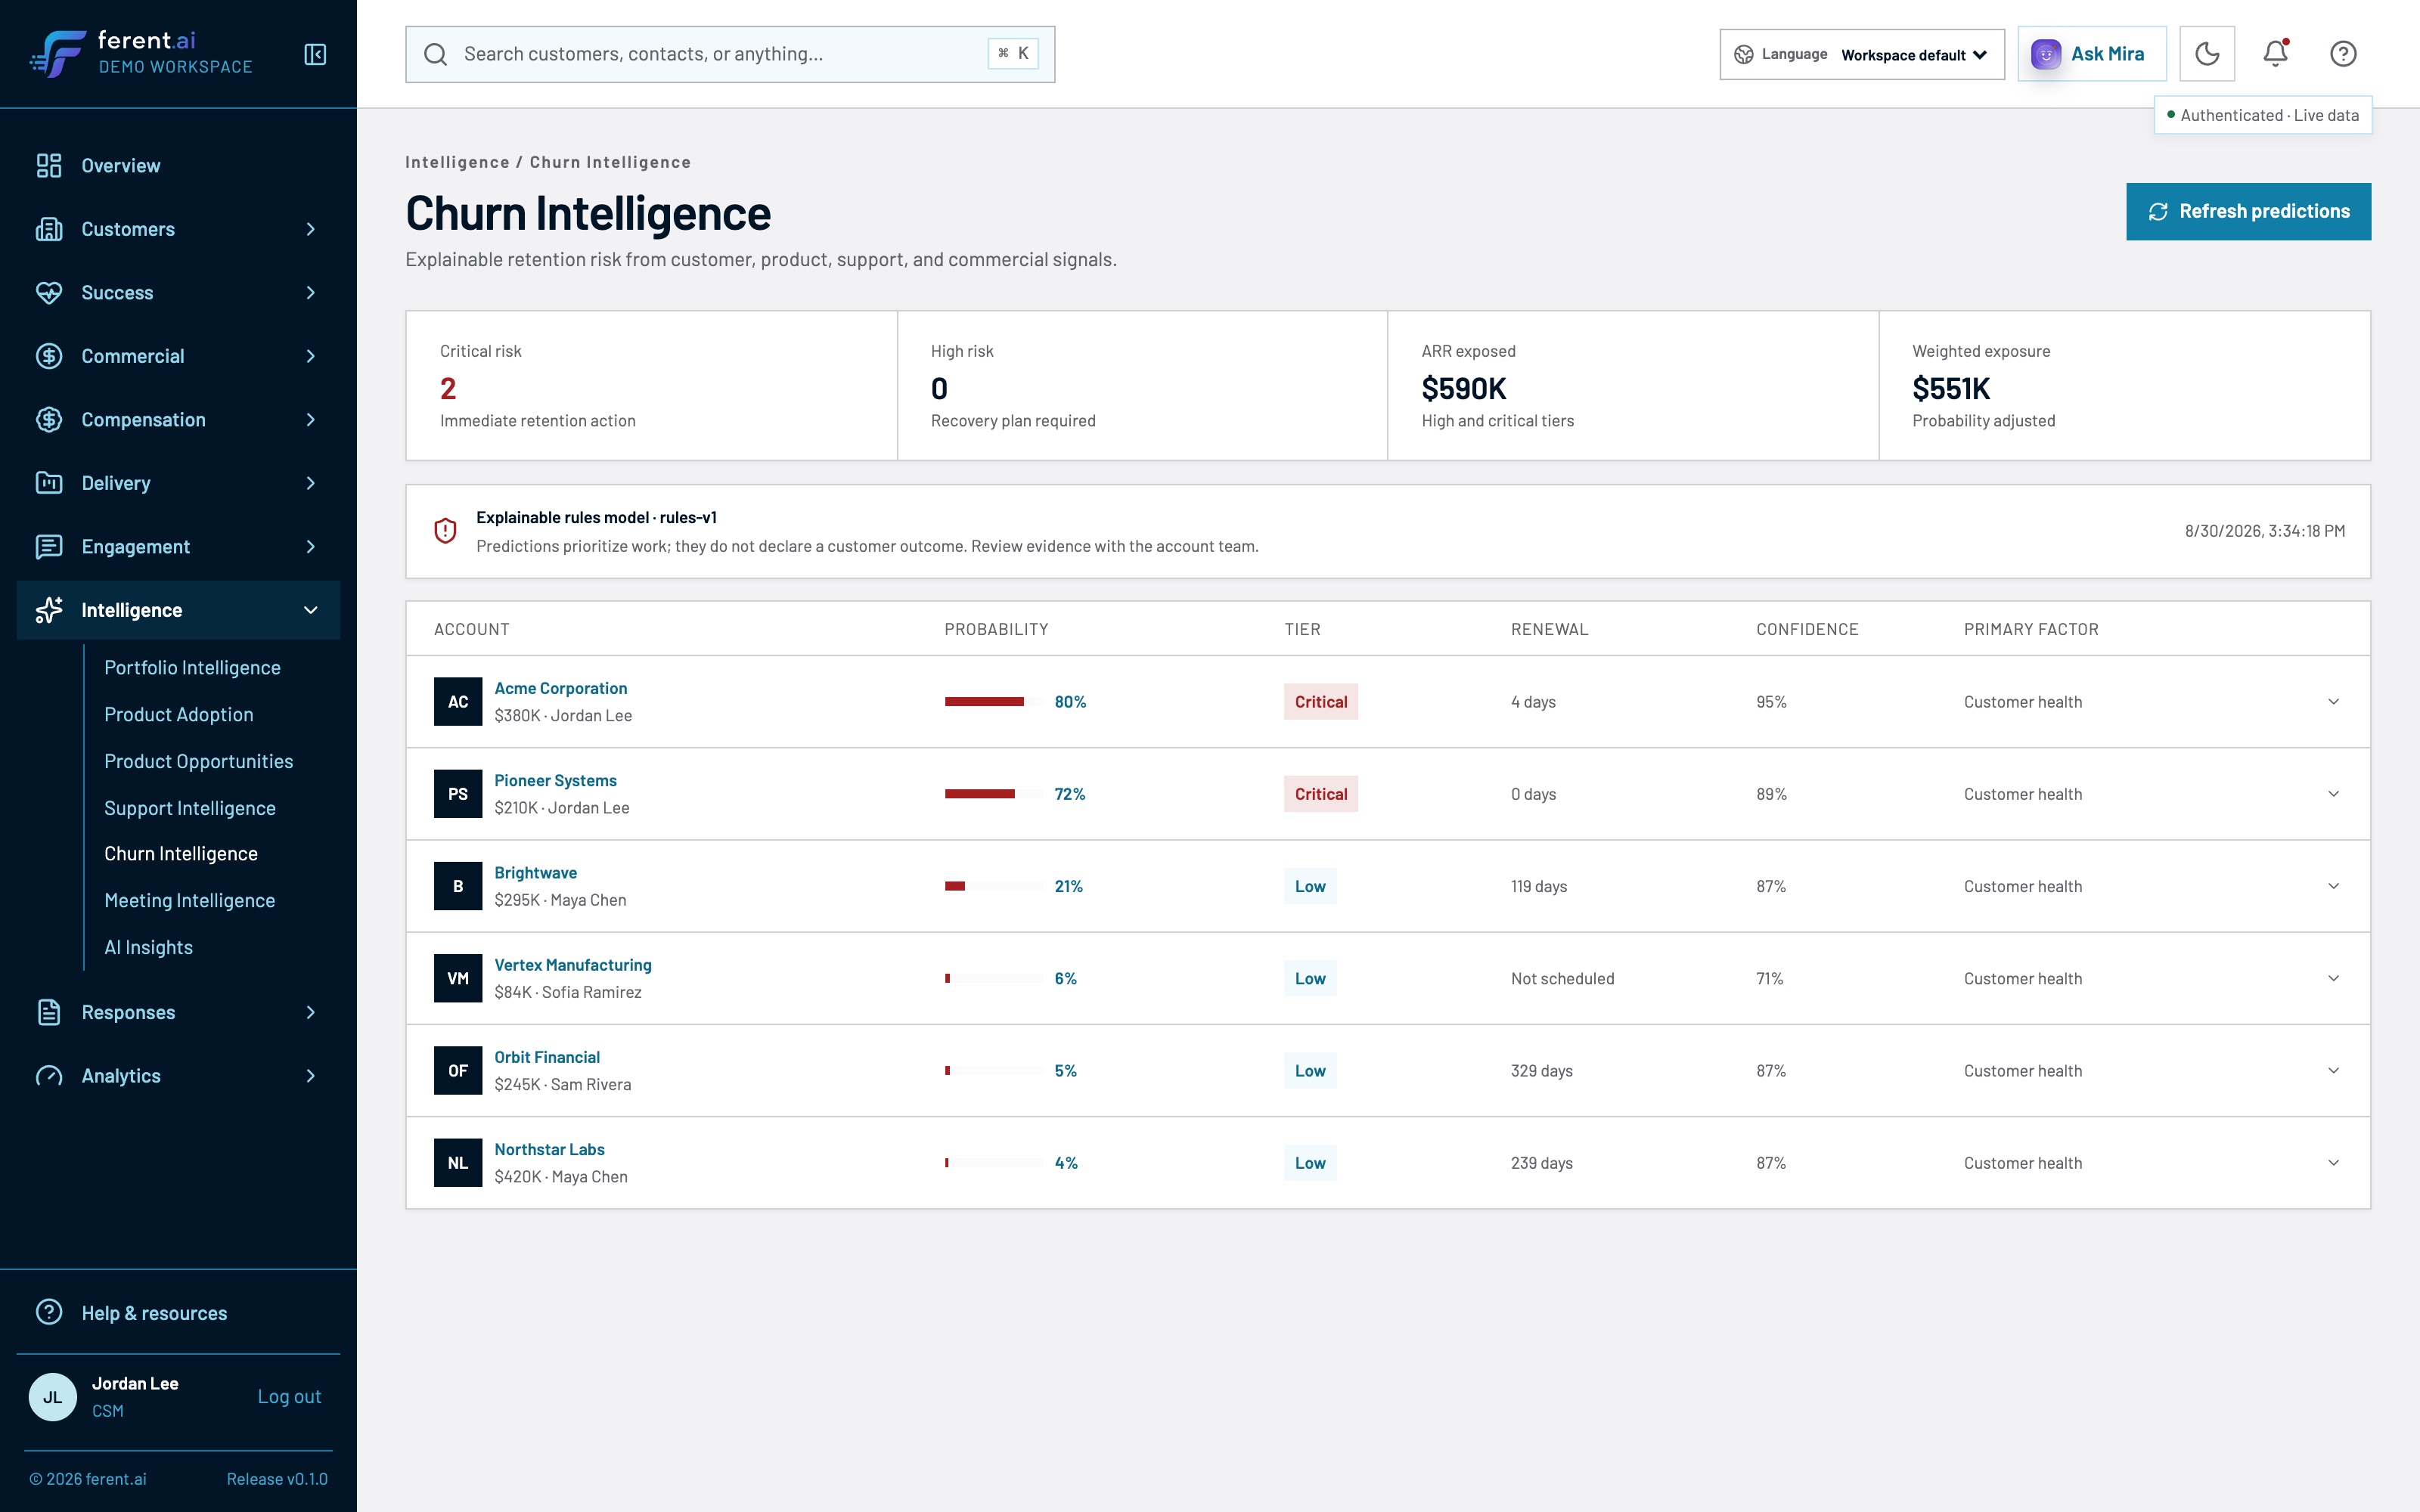
Acme 74% critical, Pioneer 66% high, a confidence figure per row, and the model named with its run time.
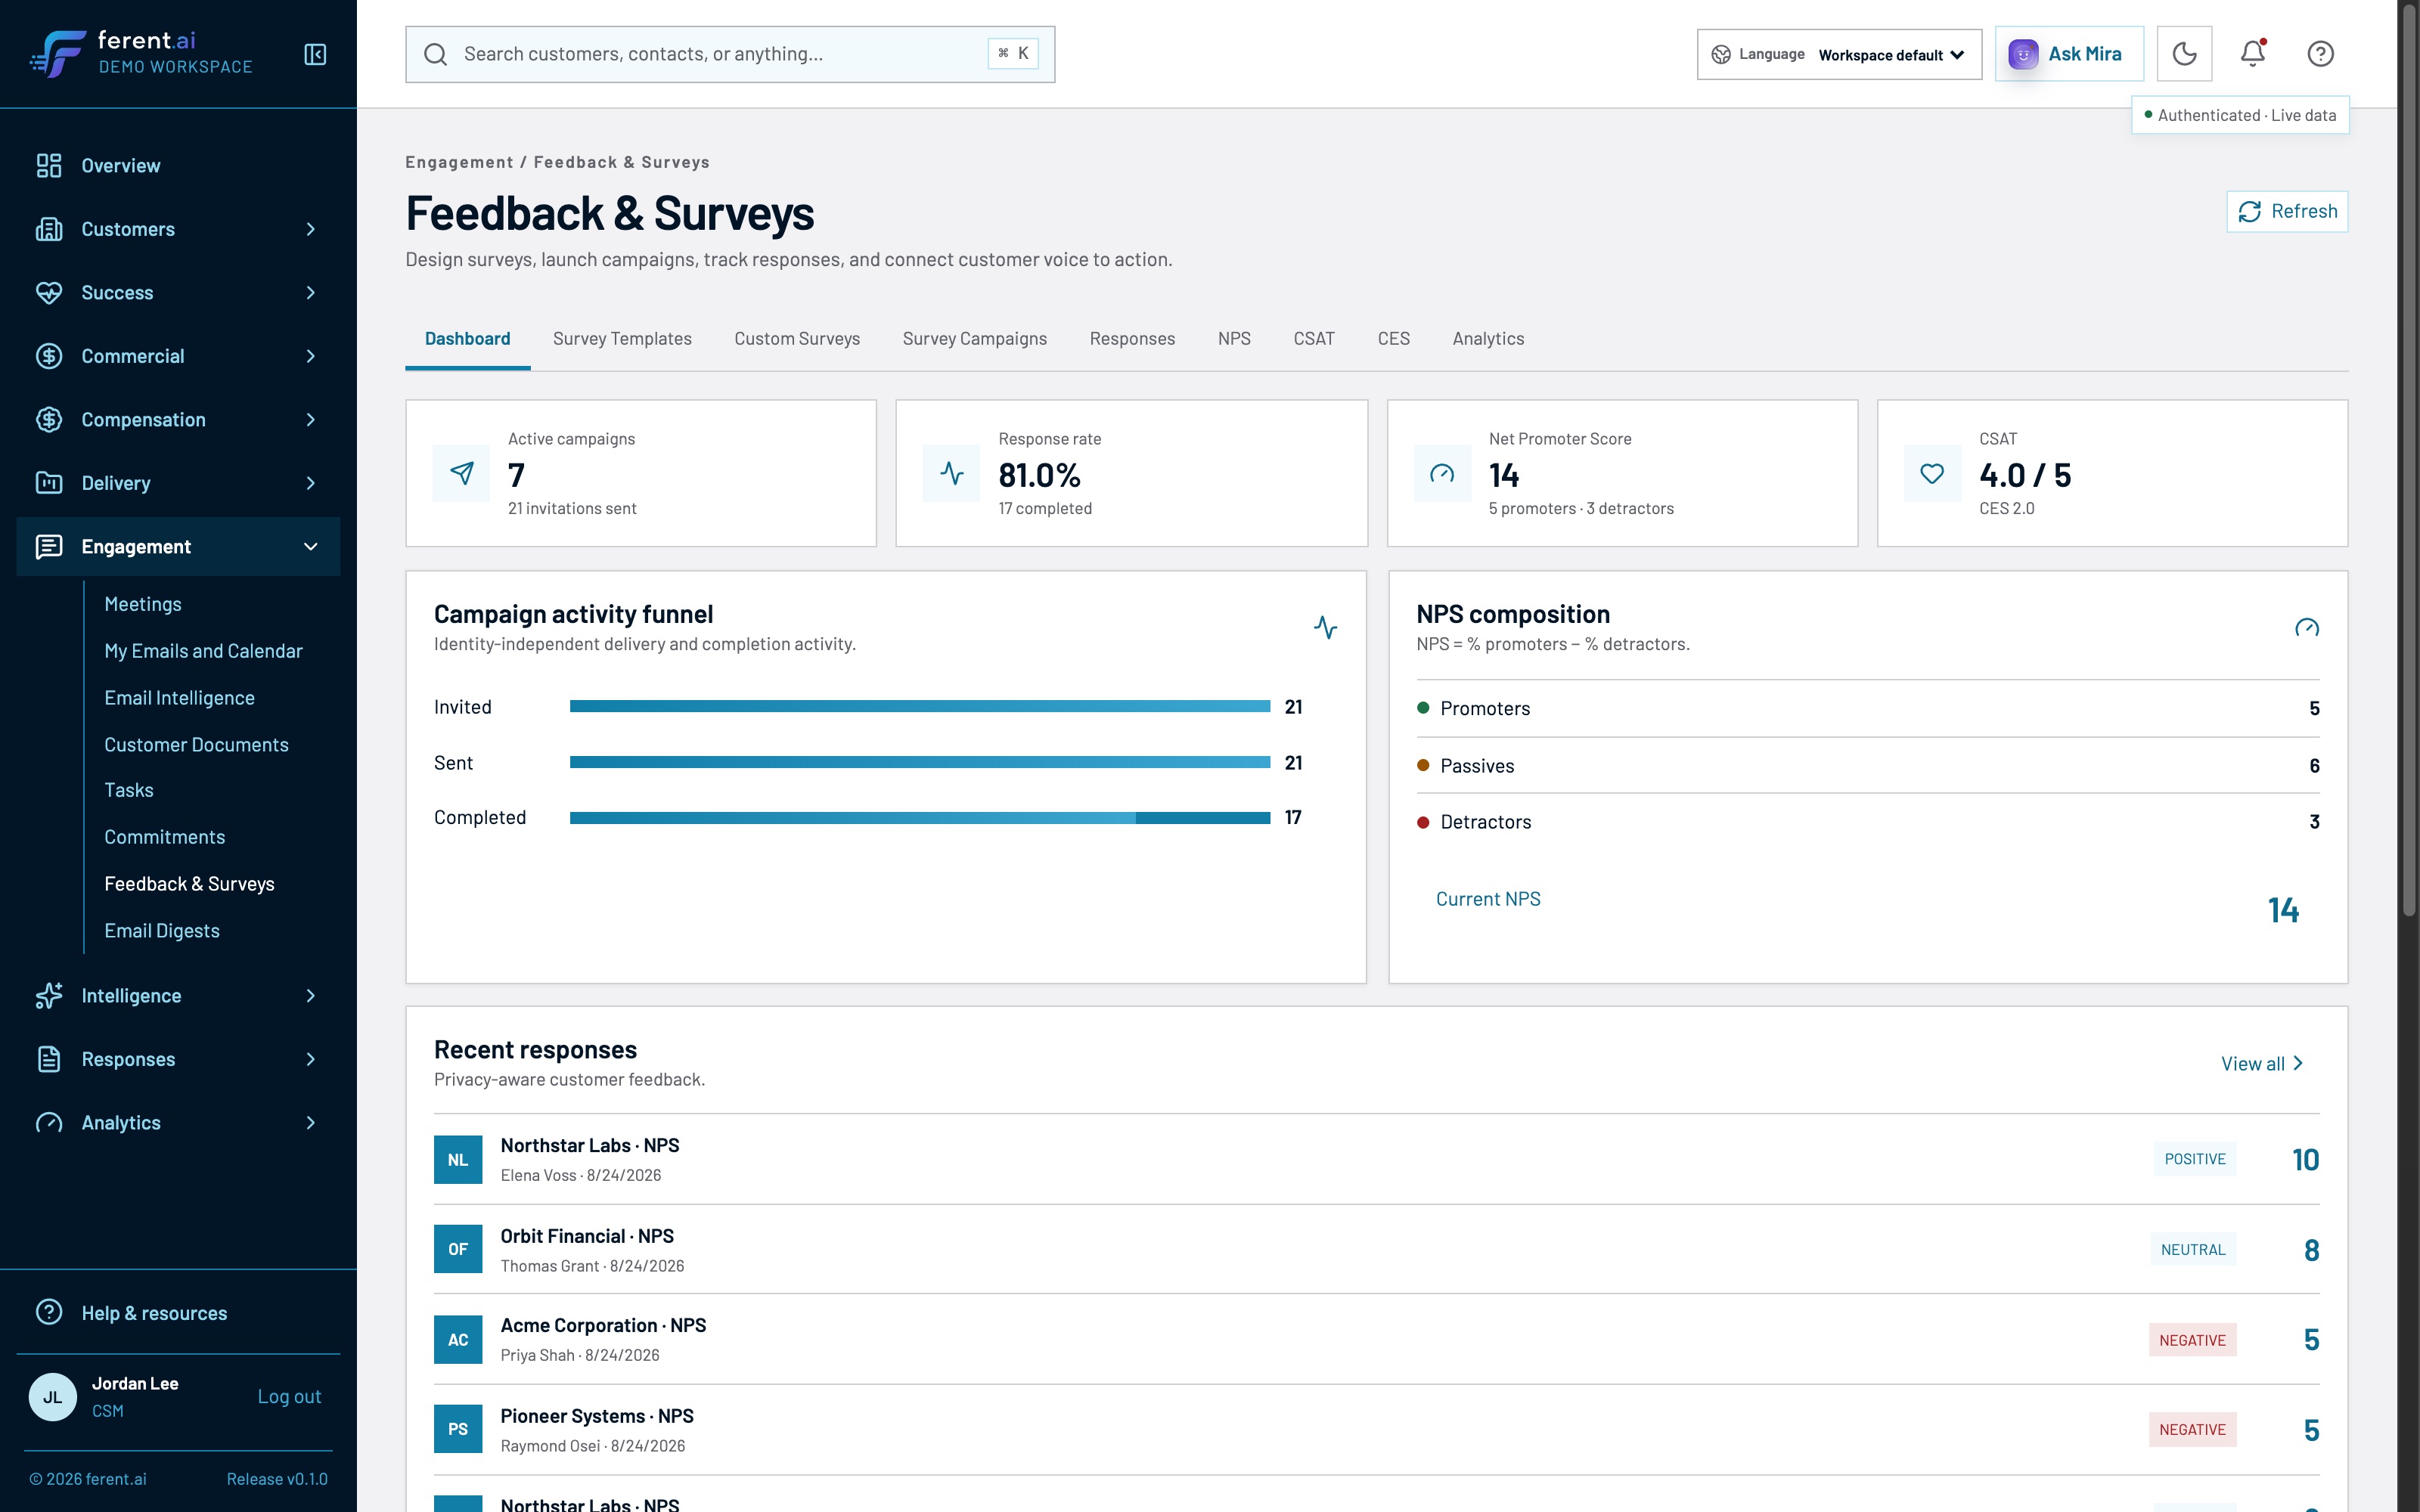
The same person named in the account’s open risk. It arrived through a governed survey, not a forwarded email.
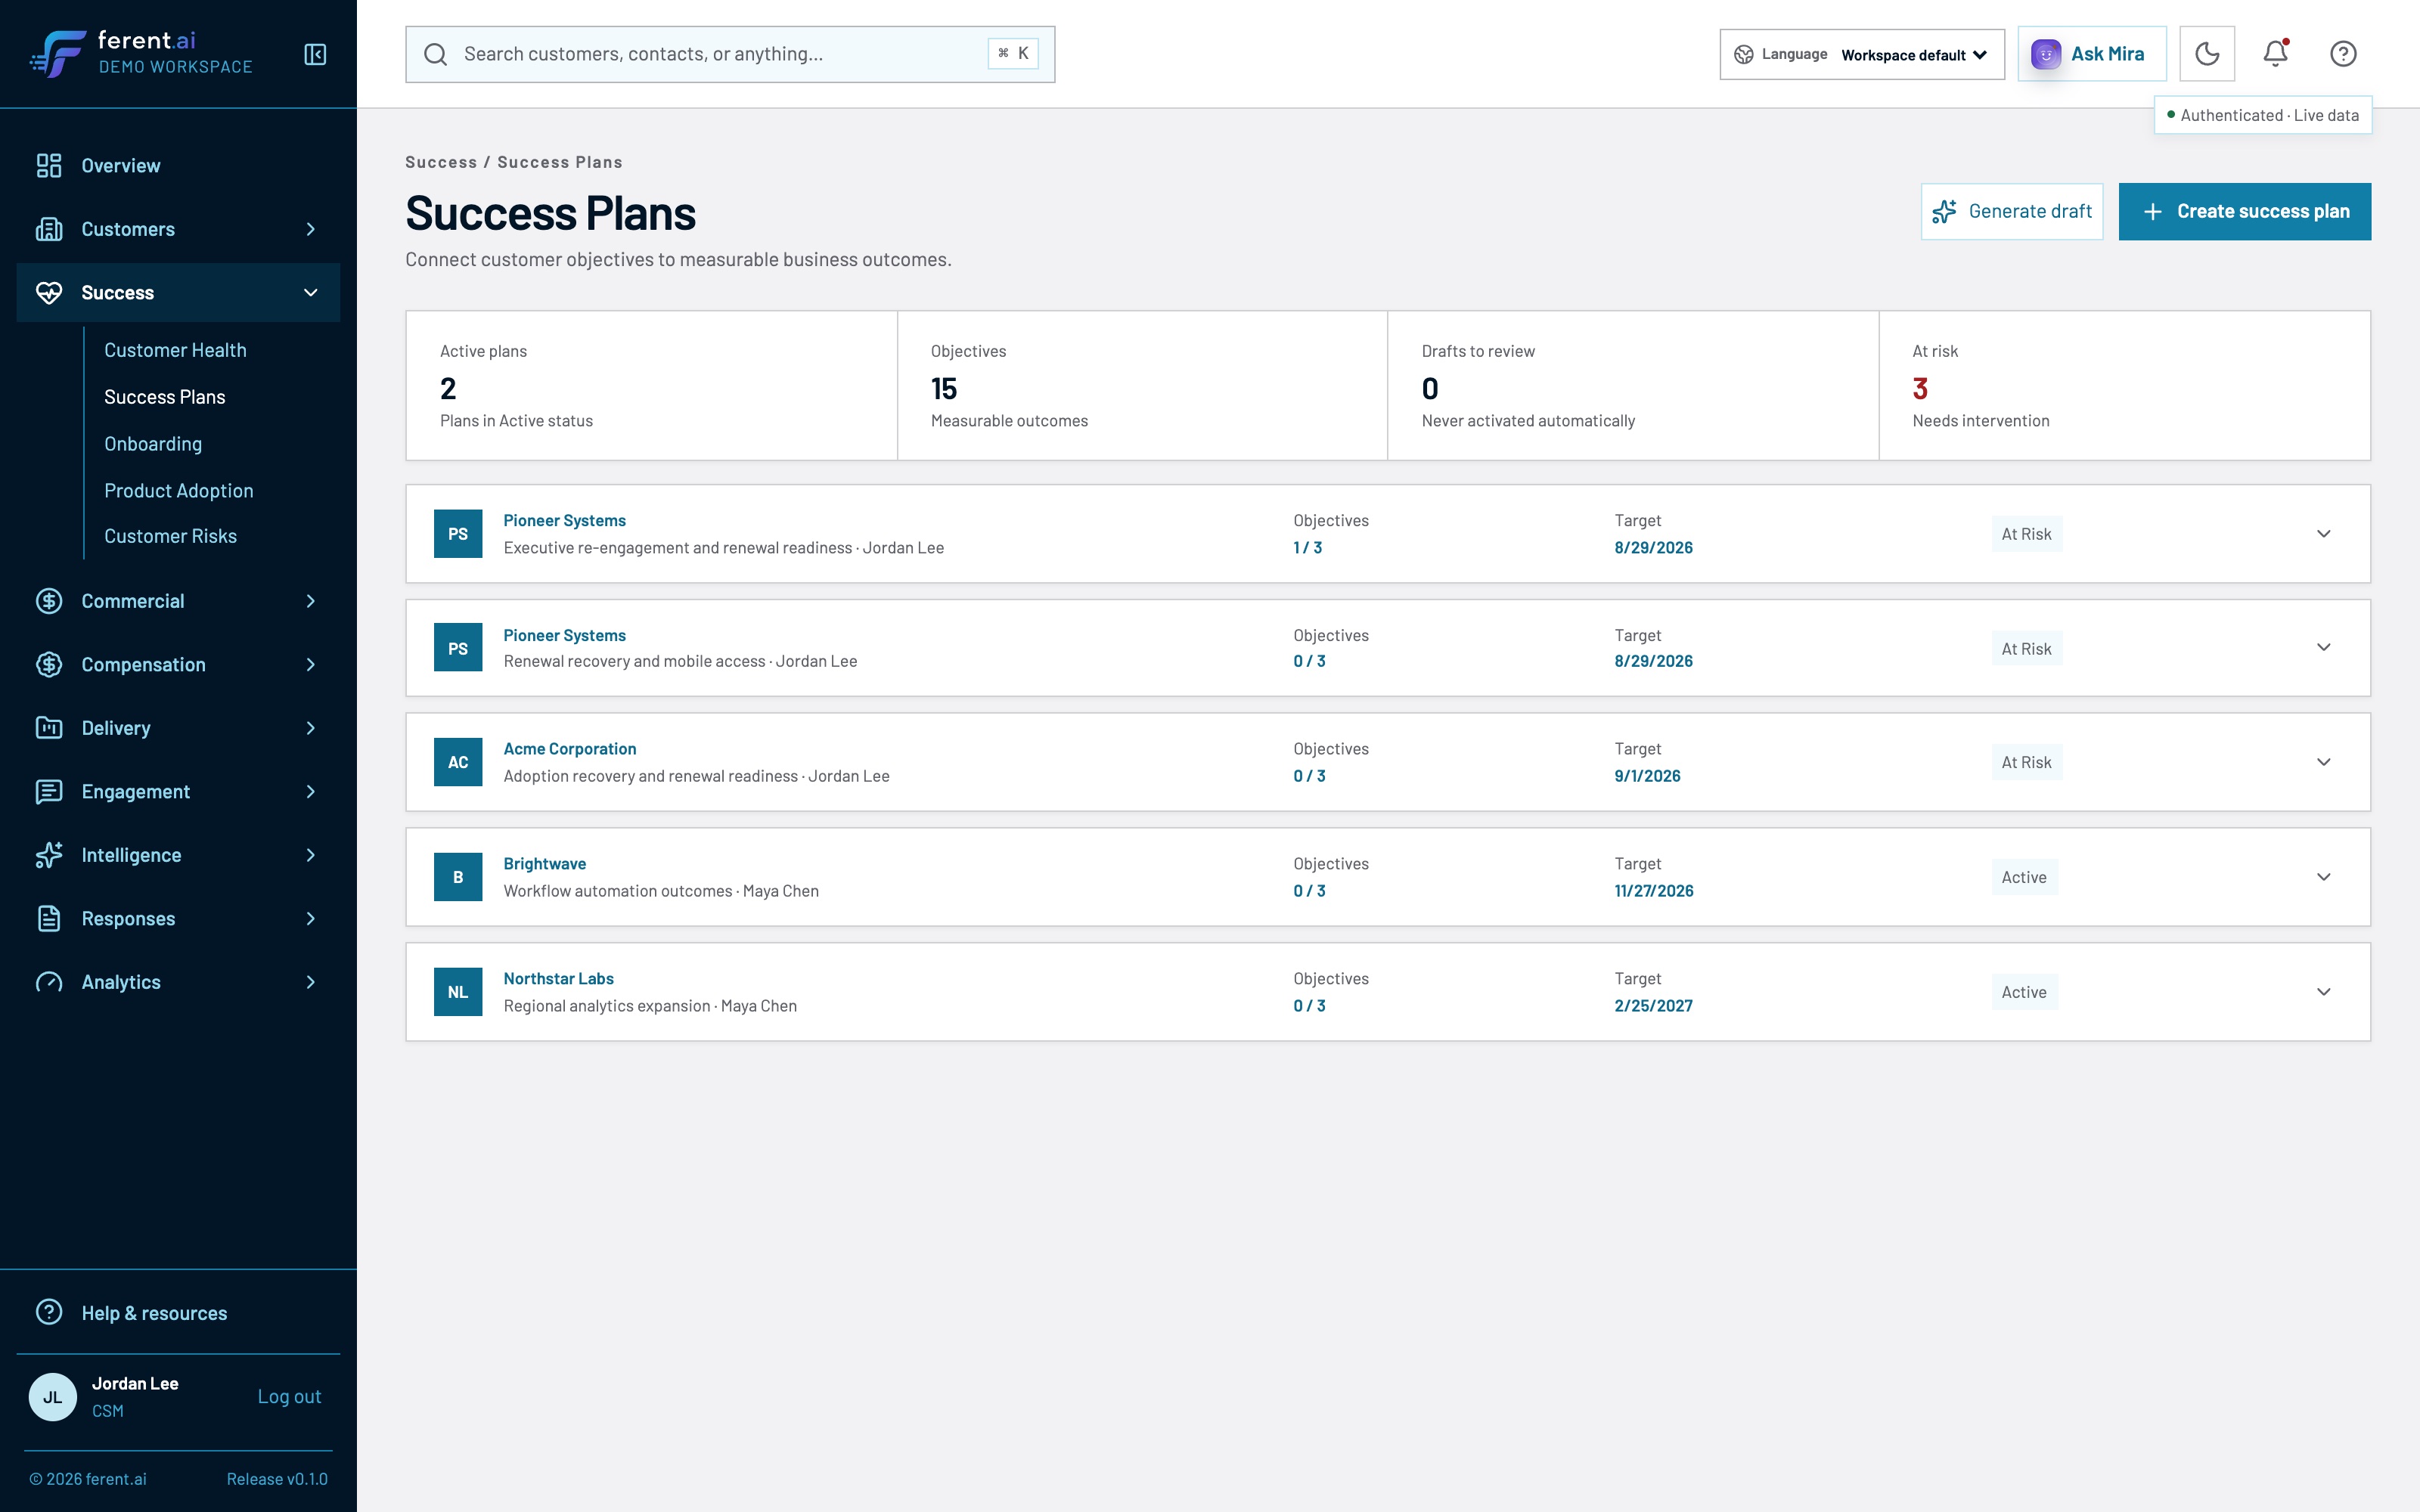
Objectives with owners, tasks with dates, due the day before the renewal it protects. The plan reports its own status as at risk.
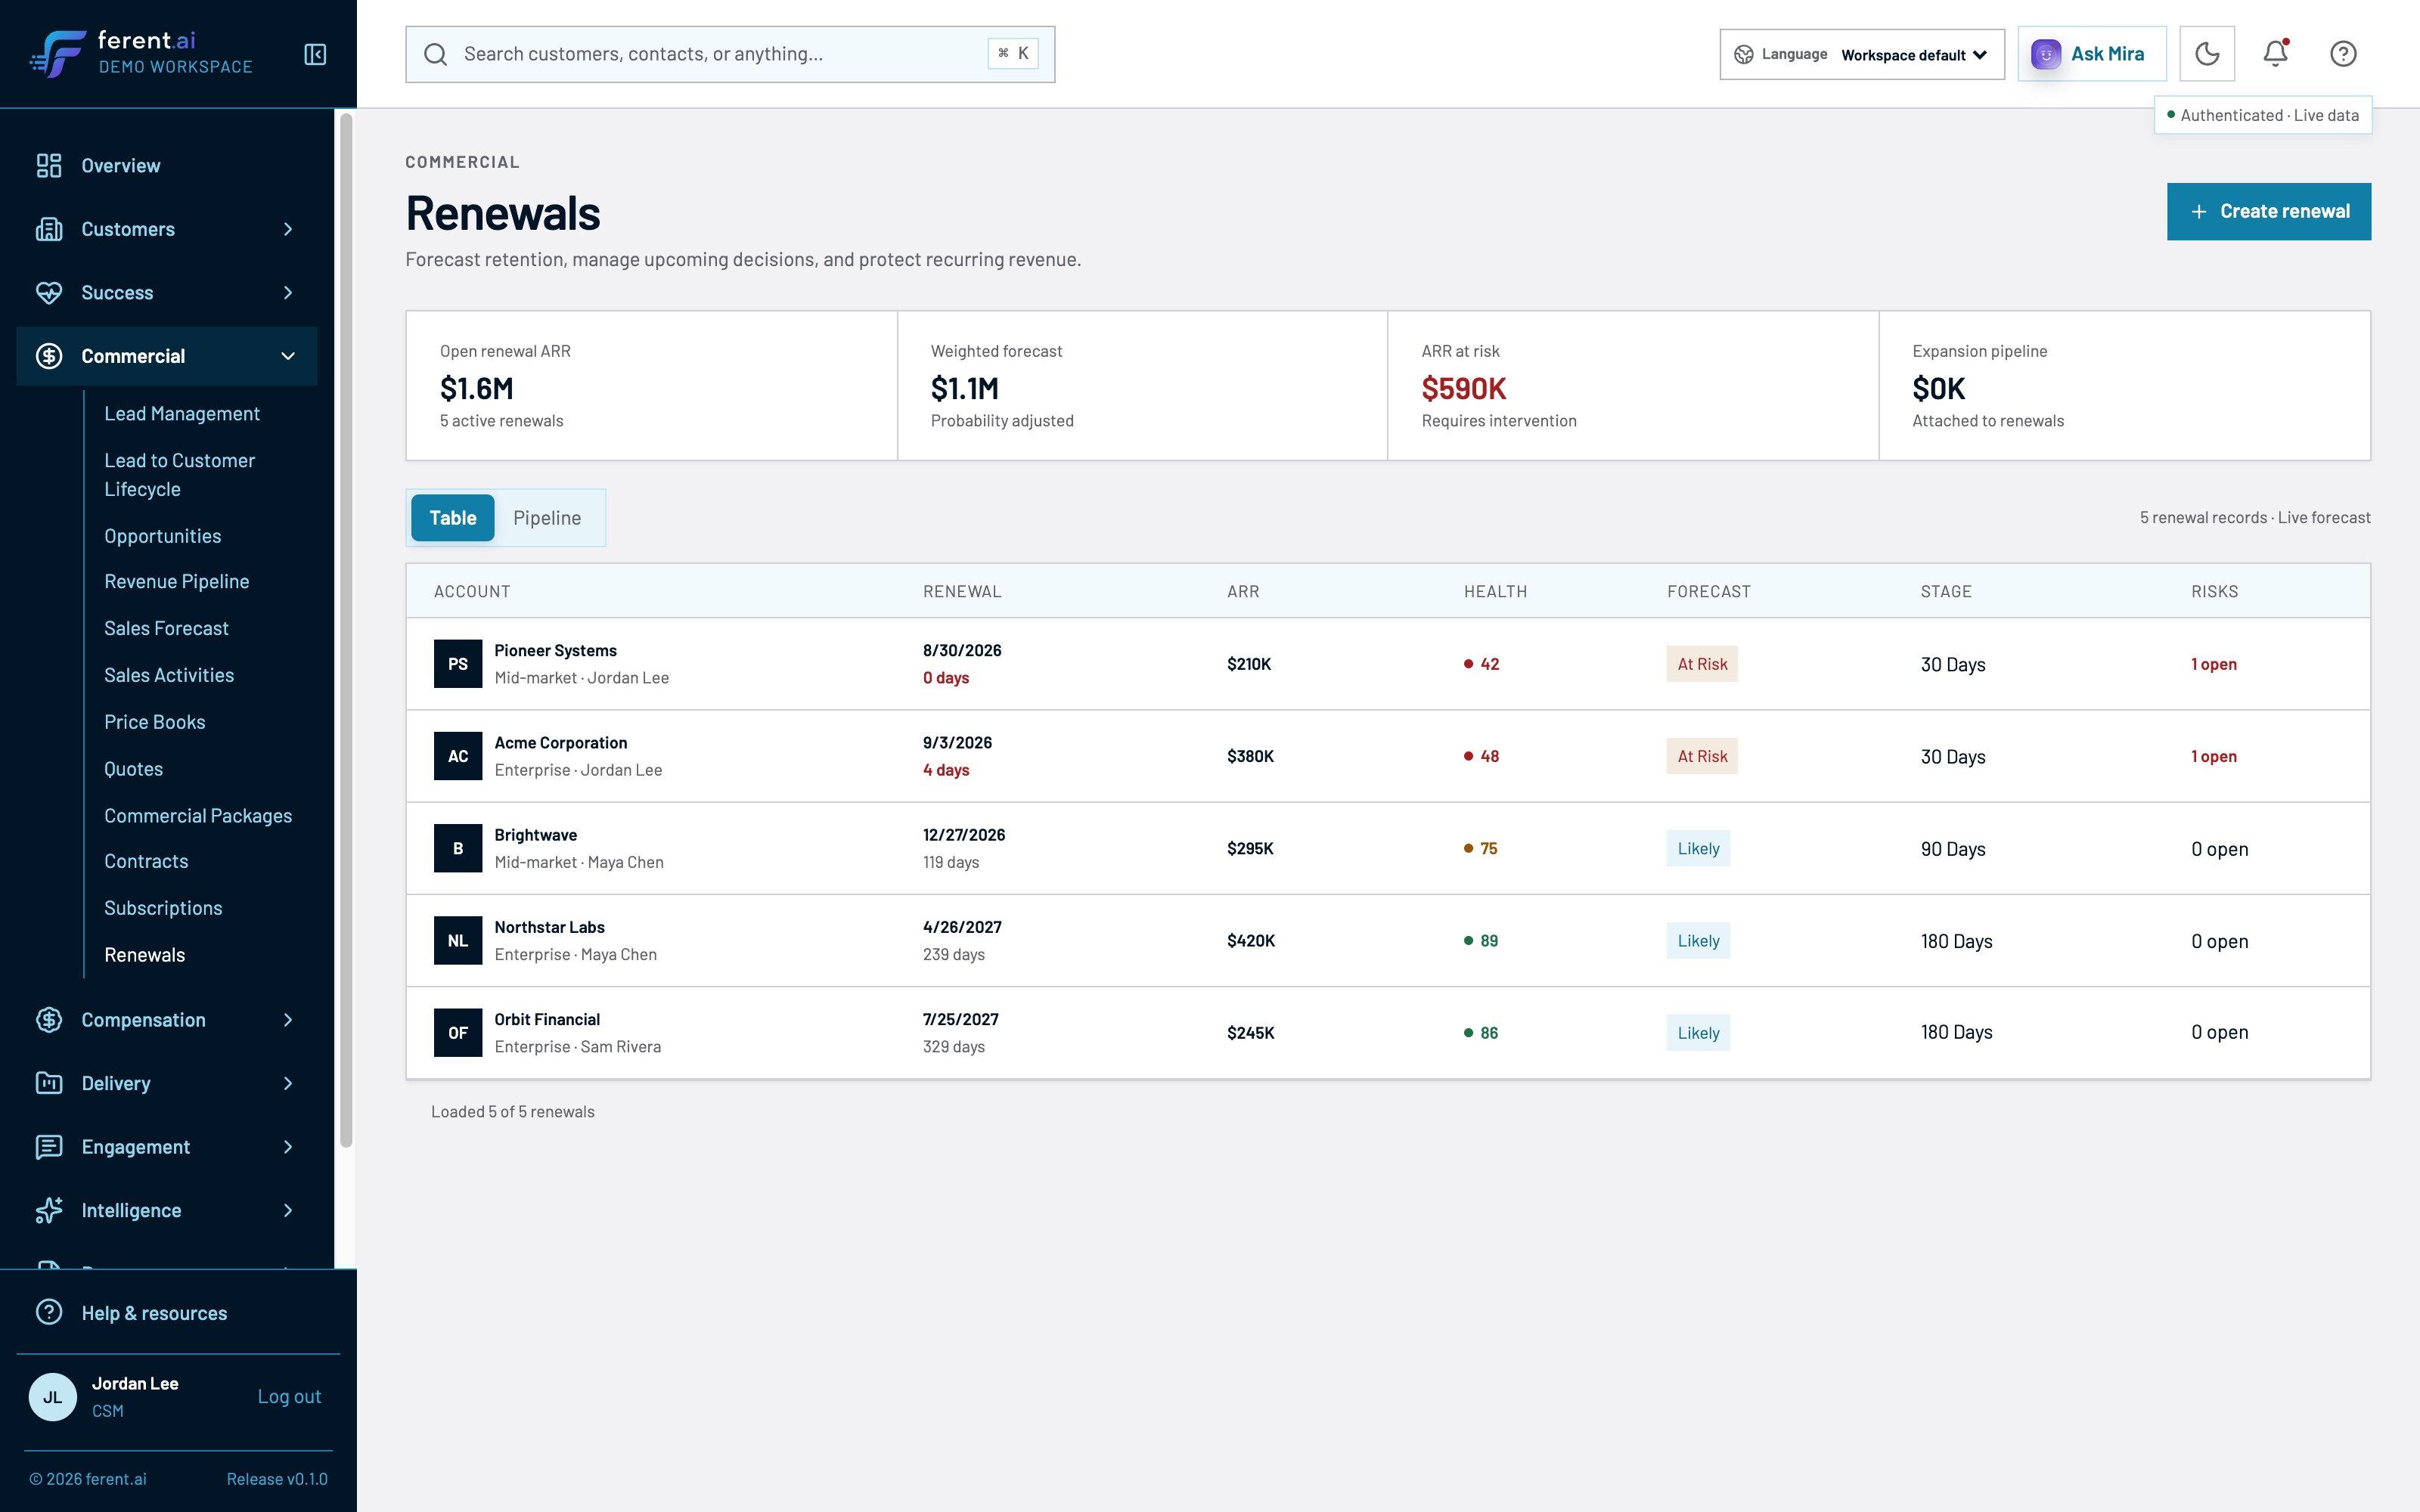
Pioneer today, Acme in four days. Both at risk, both improving, both under 60. He has time to do one properly.
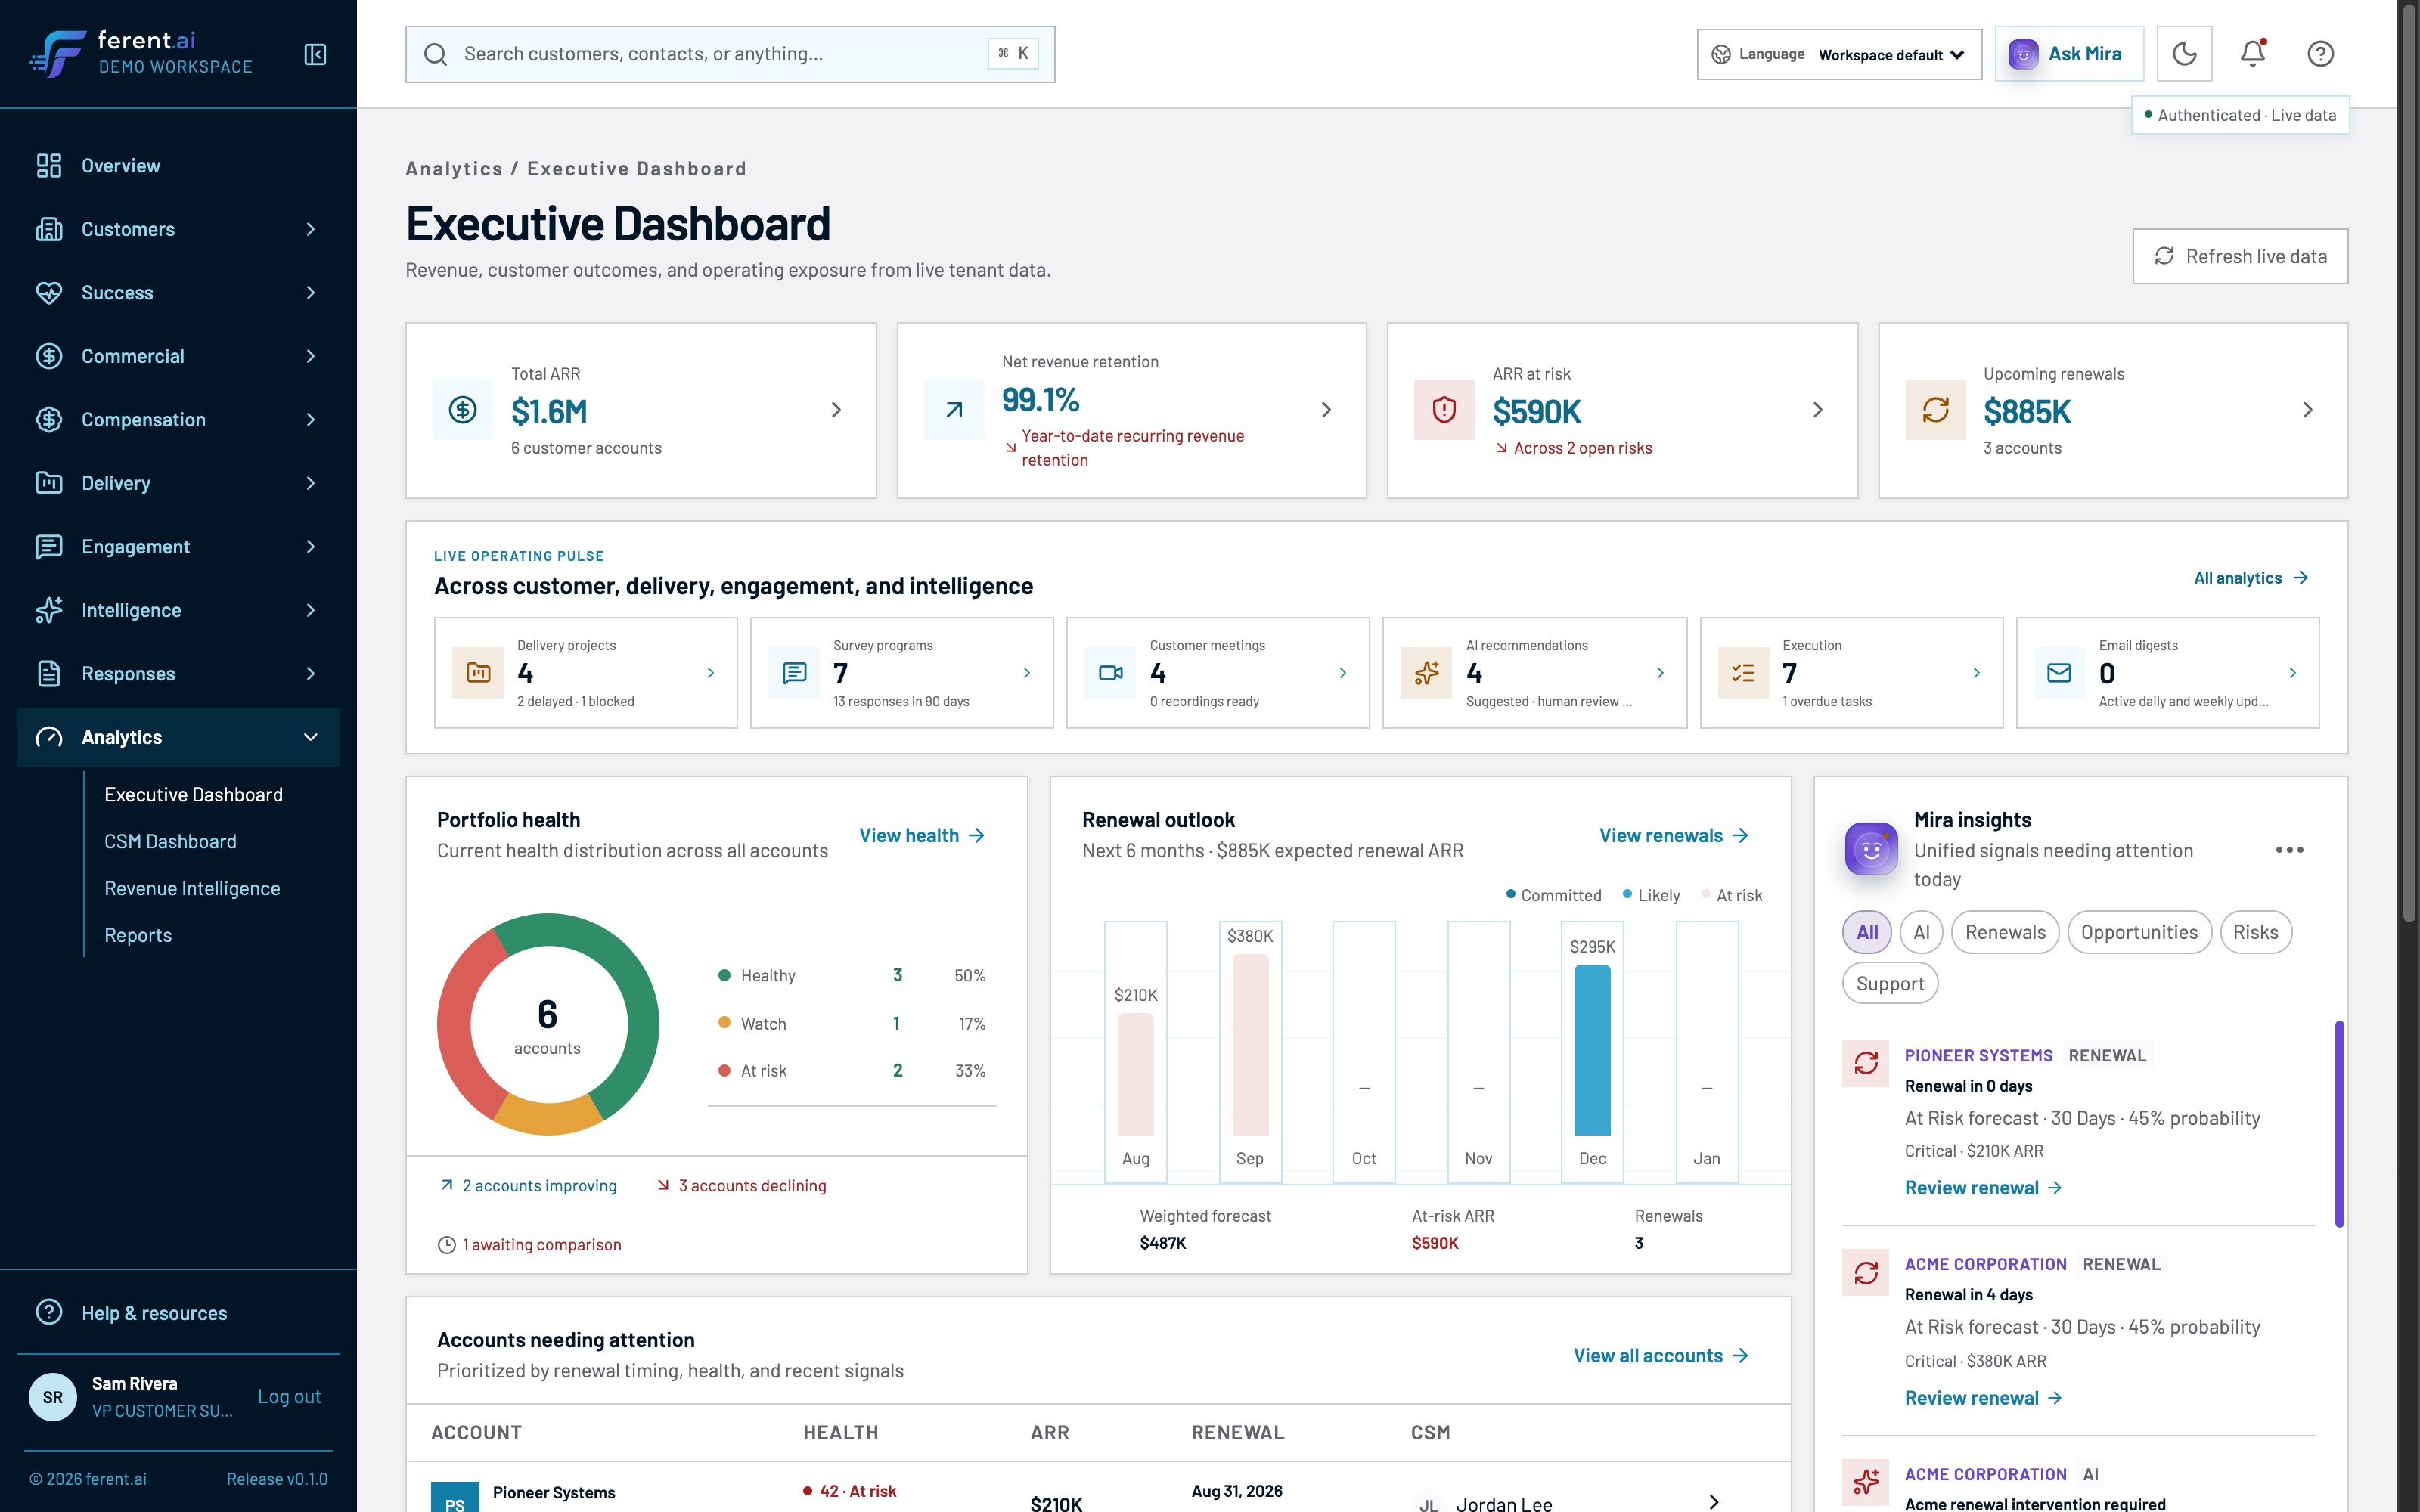
Retained, at risk, renewing, and whether the work underneath is happening. Nothing was requested from Jordan.
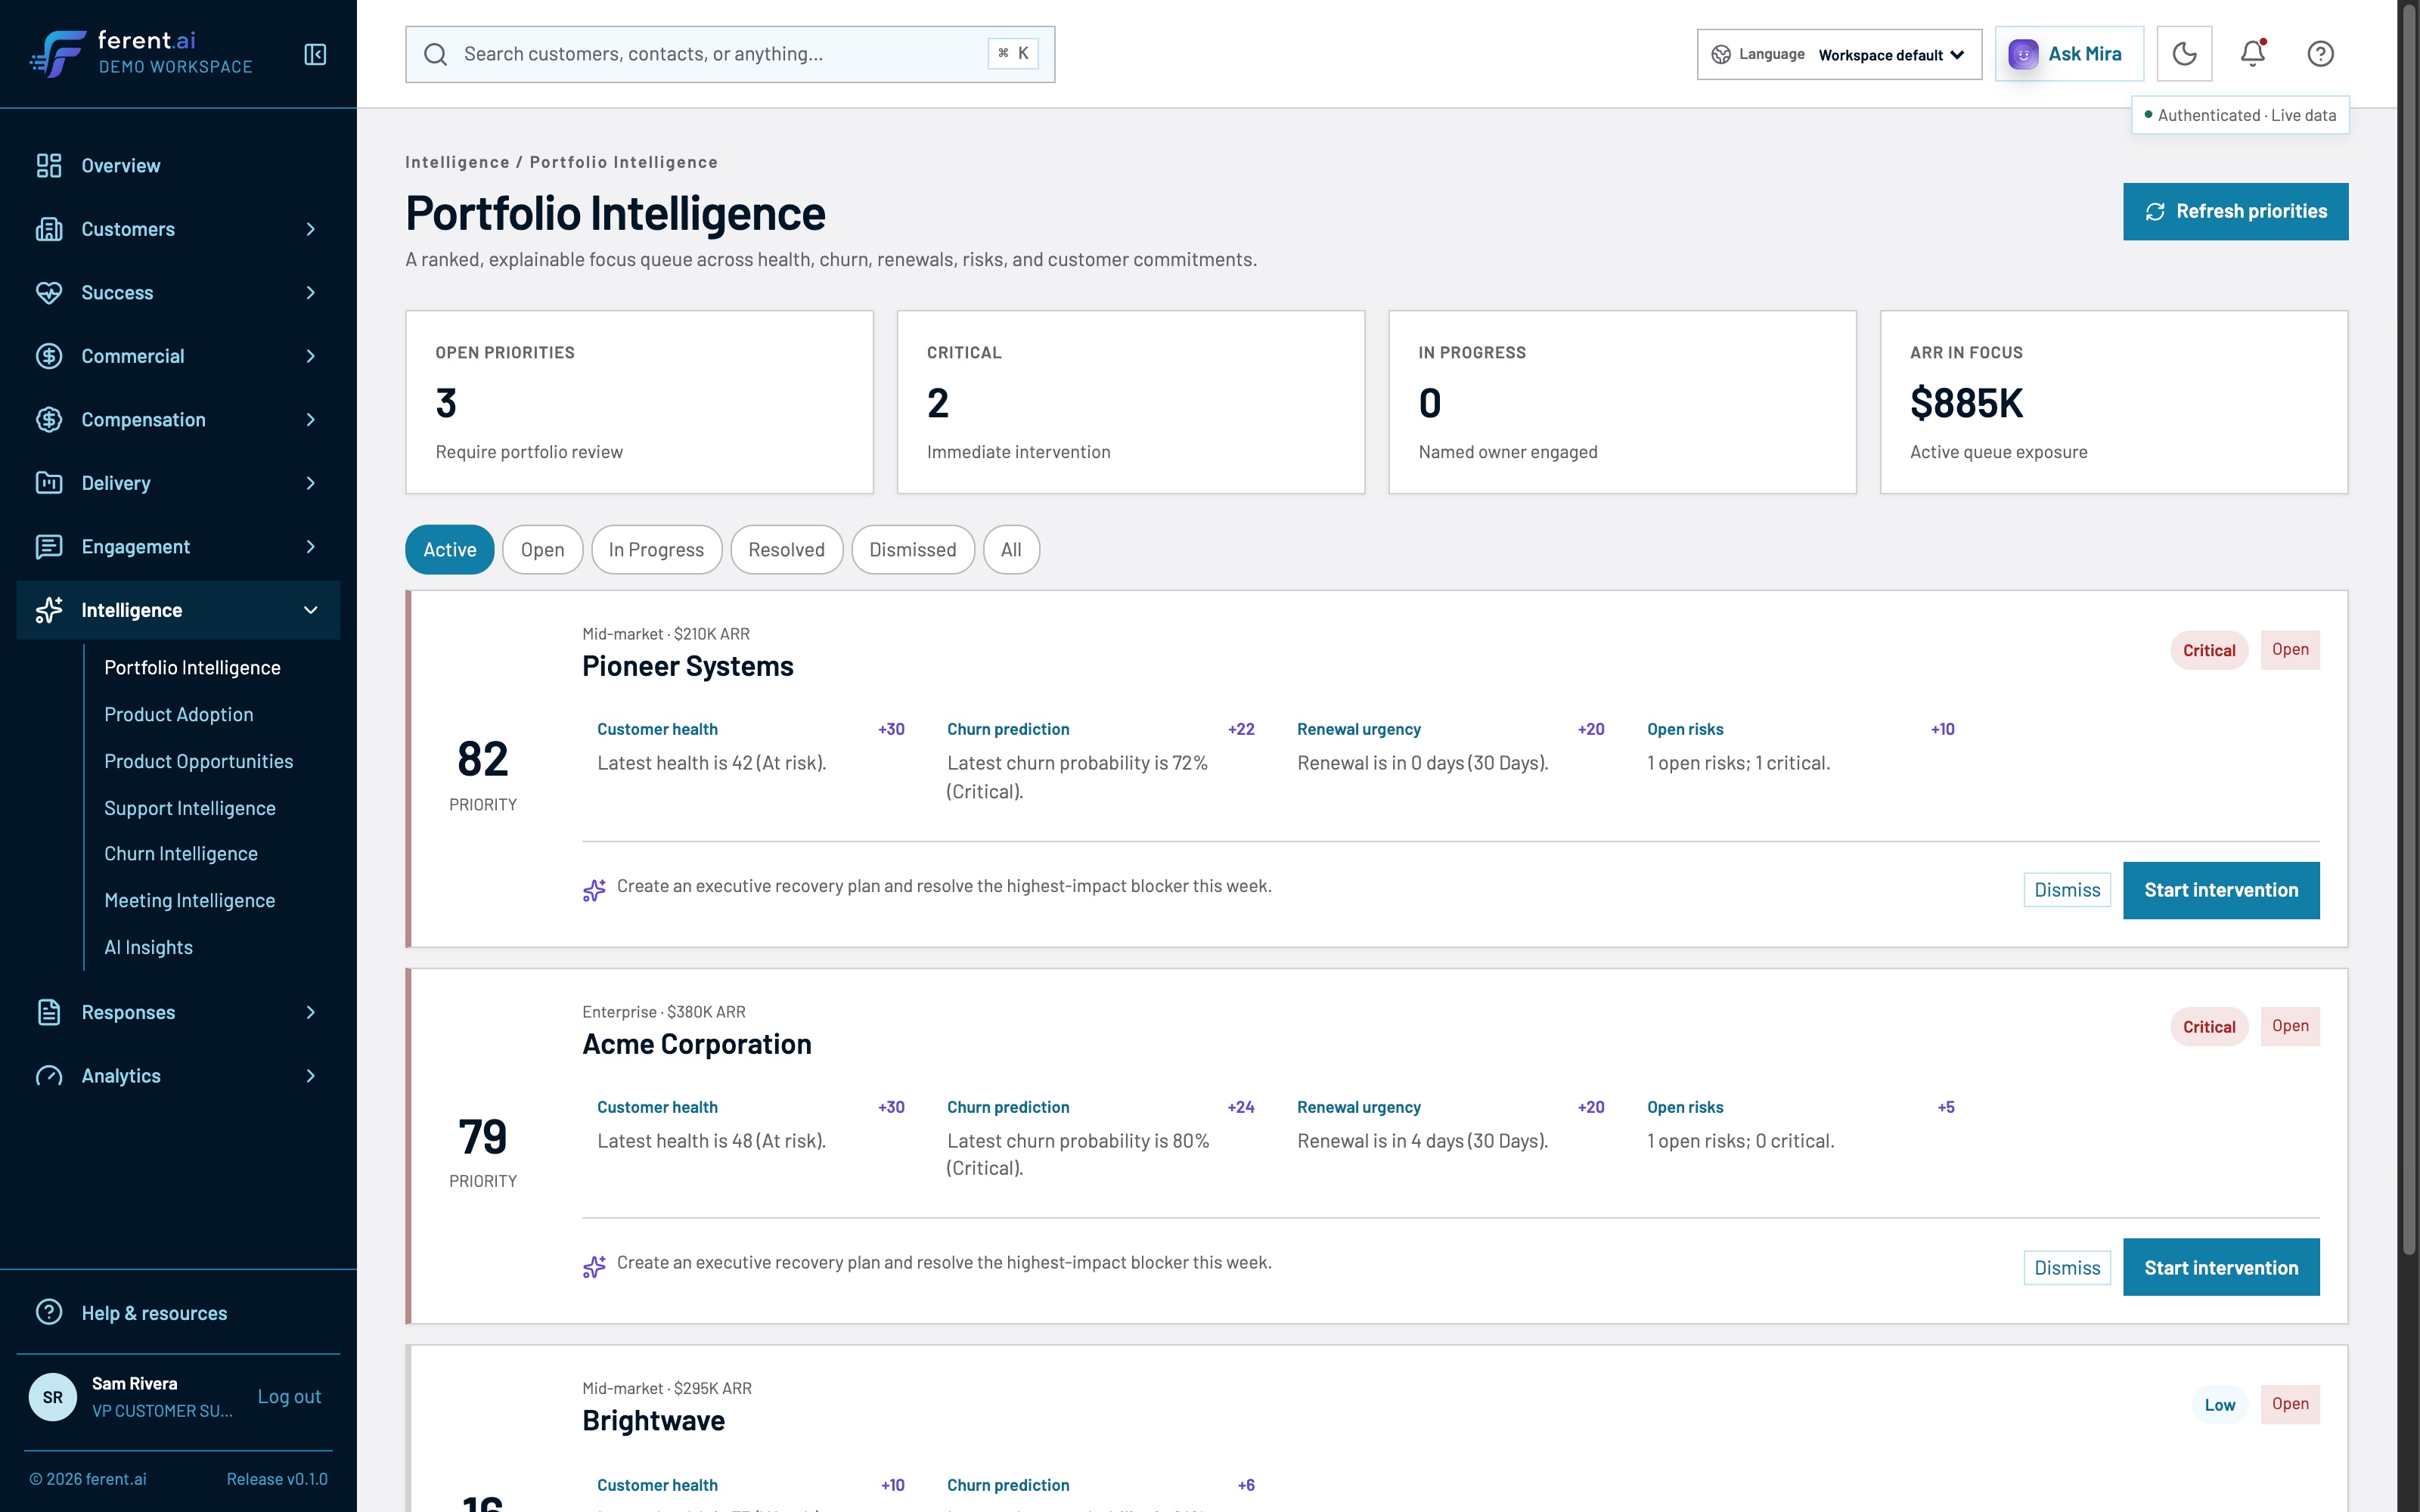
Pioneer 82, Acme 79. Acme is the worse risk and the bigger account; Pioneer still comes first, because it renews today.
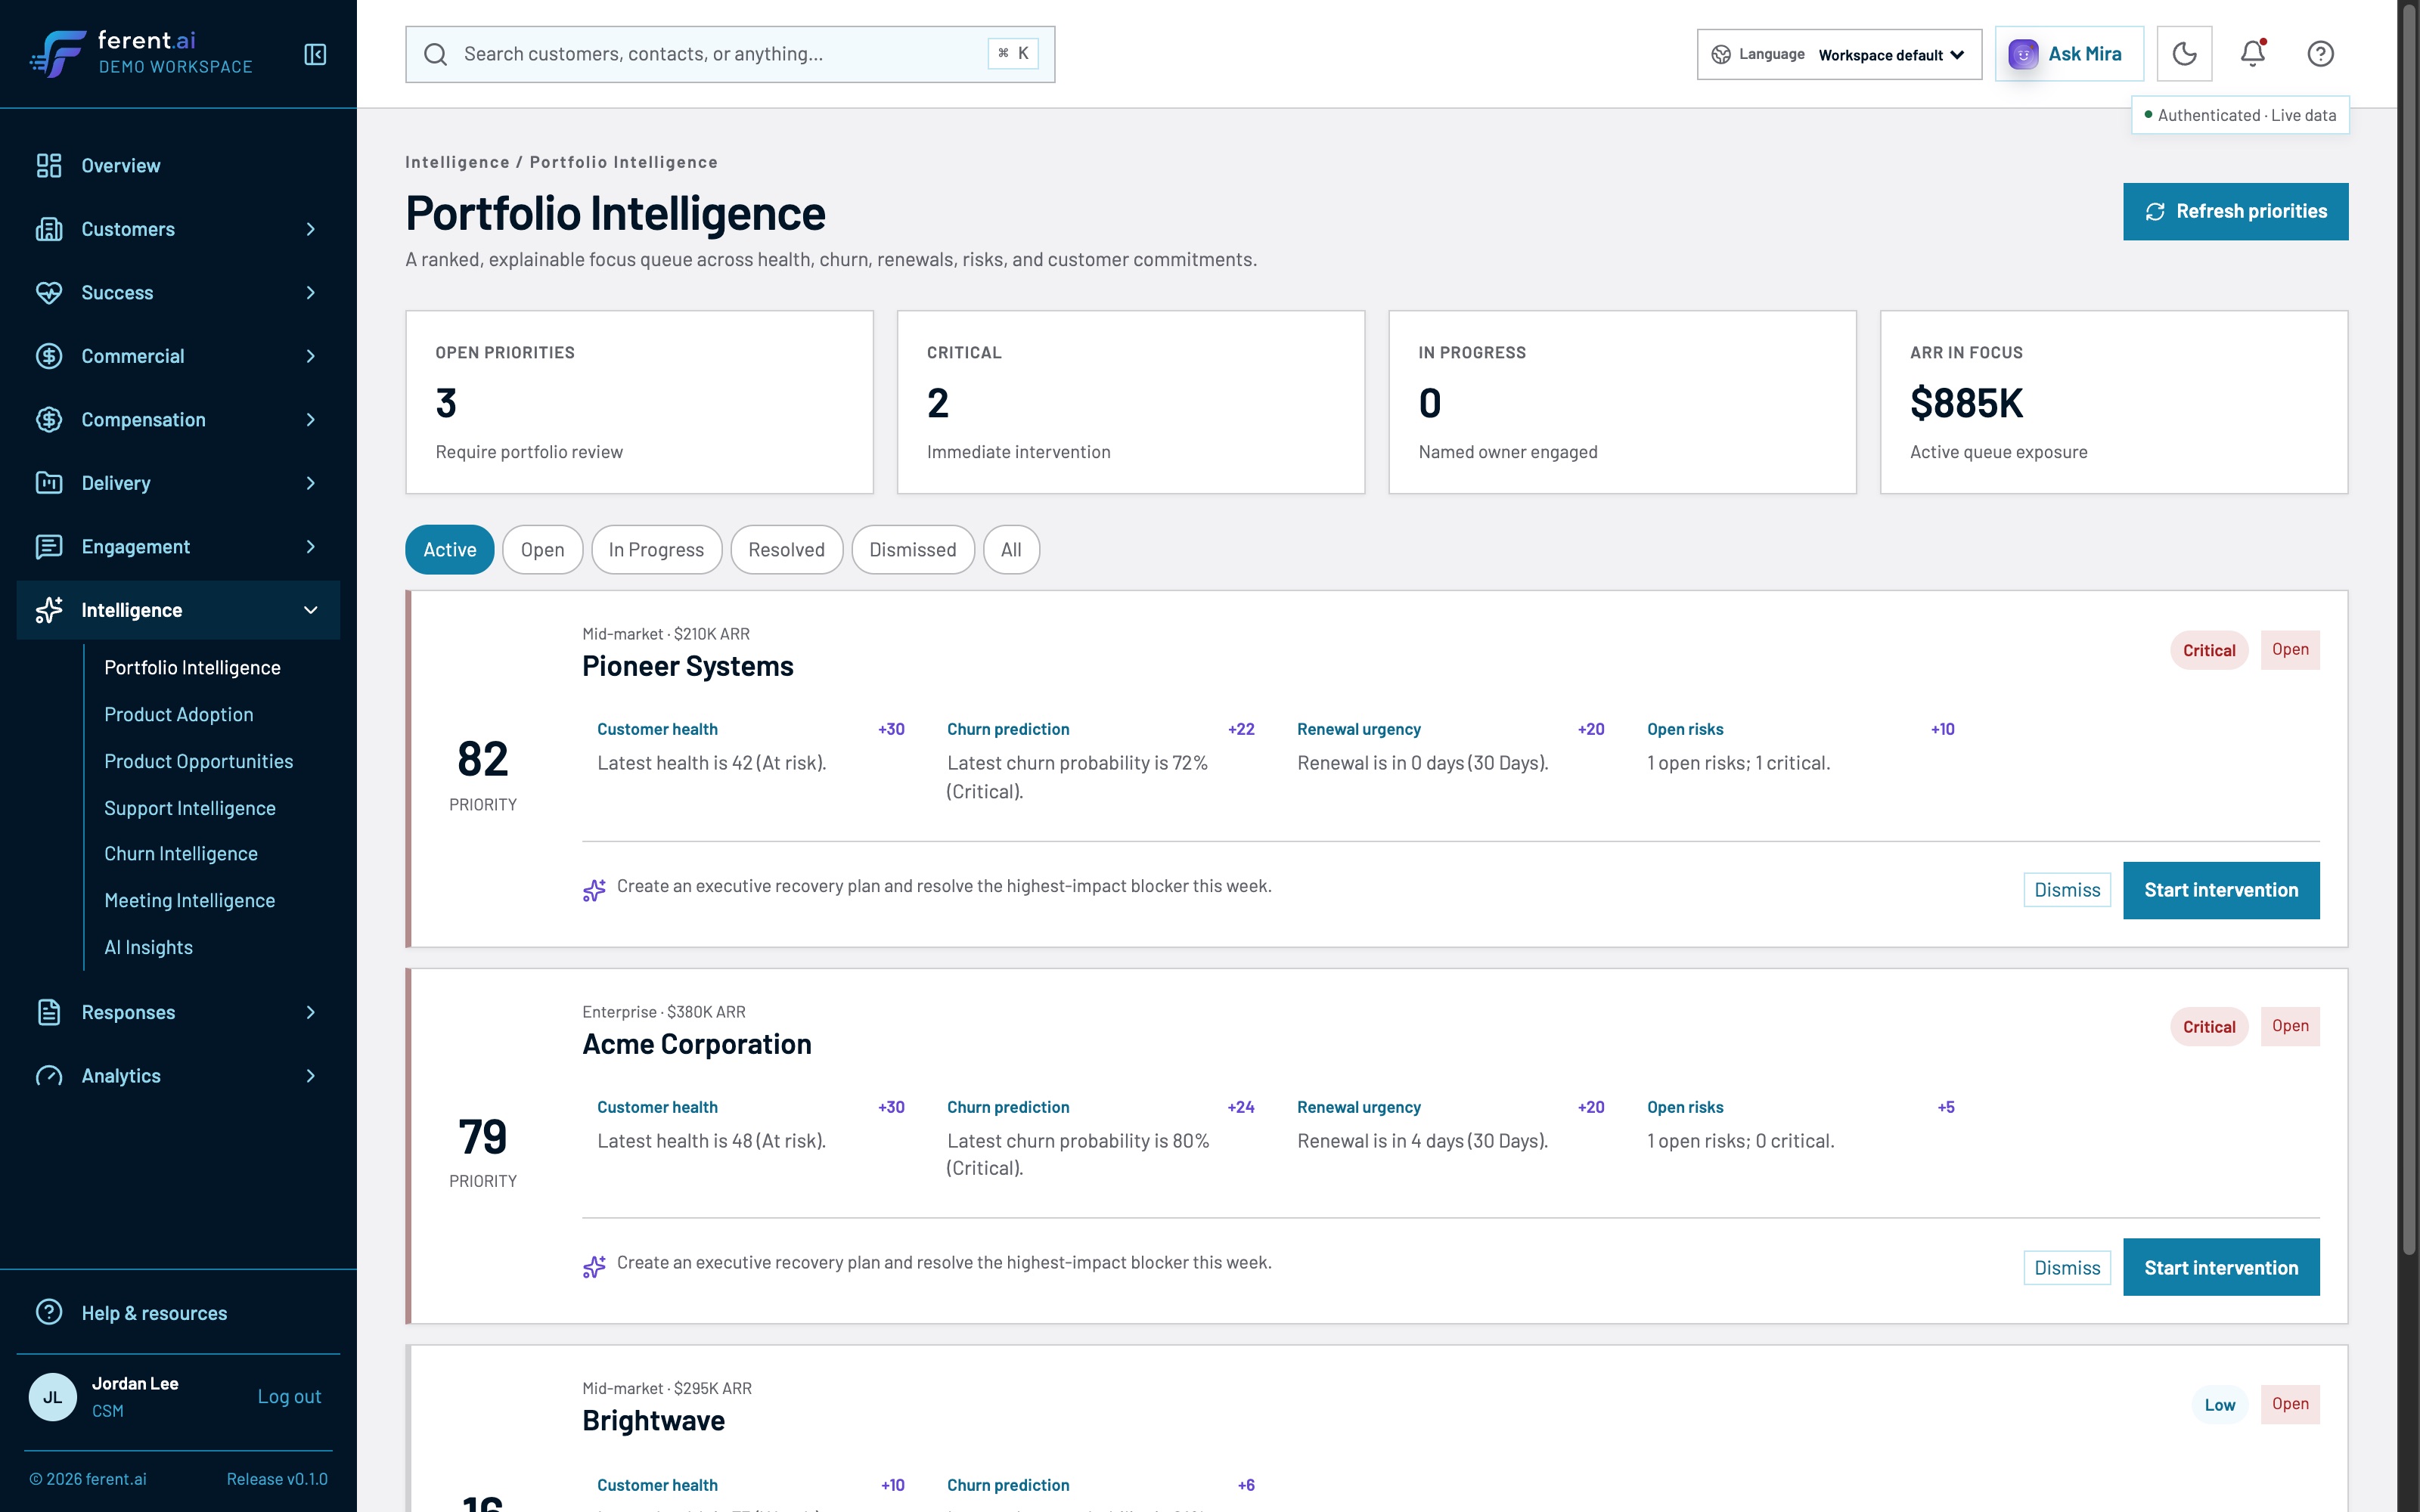
Same queue, same numbers, one difference. Jordan can read the priorities and act on them. He cannot recompute them.
Five components, weighted the way you decide.
You own the components, the weights and the thresholds. Four are calculated from data. The fifth is the CSM's own assessment, kept as its own row, so their read stays visible instead of being blended into another component.
Read straight from your data warehouse, at one reading per account, per product, per day.
Meetings and email we capture ourselves, with influence and role tracked per contact.
Ticket volume, severity and SLA performance, taken directly from your support desk.
NPS, CSAT and CES from our survey engine, on a rolling ninety-day window.
What the person who knows the account thinks. Weighted like the rest, but kept as its own row rather than folded into another component.
Four computed components, then the CSM’s own read at seventy. It carries fifteen per cent like the rest: the difference is that it is a person’s judgement, shown as its own row rather than folded into one of the others. Check it: 38×.30 + 35×.20 + 40×.20 + 35×.15 + 70×.15 = 42.
Every prediction comes with its working.
| Probability and tier | Ranked across the whole book |
| Confidence | A confidence figure on every row |
| Contributing factors | Named, with the evidence behind each |
| ARR exposed | Attached to the risk when it is raised |
| Model version and run | Named and timestamped on the page |
The page says what the prediction is for: deciding what to work on first, not declaring a customer lost.
From signal to decision.
Your CRM stays your system of record. Signals adds the path from the event to the person who needs to know about it.
None of these wait for someone to notice. Building the same paths from separate tools means three integrations to maintain. One competitor acquired a company just to get the survey-to-health link.
Portfolio shares its survey and compensation engines with the platform, so one event can move a health score and feed a bonus calculation. Onboarding as a delivery module is still being built; the NRR and renewal-outcome bonus calculation runs today.
Direct database connectors, including PostgreSQL. No analytics vendor in the path.
We read accounts, contacts and opportunities. Writes go back only for fields you enable, and only after someone approves the change.
Teams, Zoom and Slack contribute metadata and transcripts. Recording comes from our own recorder, named in the room, and only after someone attests to consent.
Freshdesk, Zendesk, Jira Service Management and ServiceNow CSM feed health directly. SharePoint documents stay where they are. We hold a pointer and your permissions still decide who opens them.
Knowing which account is only half the job.
Everything above tells Jordan which account to work. What follows is how he acts on it: the quote, the contract, and the four outcomes that make up your net revenue retention. Same product, same record, no handoff in the middle.
A renewal starts from the contract you already have.
It is a loop, not a pipeline. The subscription on the books is the starting position, health tells you which way it is heading, the quote is seeded from the lines already there, and signature closes one term and opens the next.
Contracts and subscription lines, with what each one is worth and when it comes up. Nothing starts from a blank quote.
The quote is seeded from the lines already on the subscription, then priced against your price books and rules. Discounts route for approval in the same flow.
Eight stages to signature, with the proposal built from versioned templates so the sent and signed versions share a history. At-risk status is computed from health, not read off a calendar.
One of four outcomes lands: renewed, expanded, contracted or cancelled. Each writes an audited ARR movement, and the NRR and GRR bridges trace back to the records behind them.
Where the two halves meet.
A renewal is where the two halves of Portfolio meet. Renewals prices and forecasts it, Signals scores the health behind it, and the shared compensation engine pays out on it.
Nobody rekeyed anything or wrote a report. The forecast changed because the record did.
That boundary, the row-level isolation under it, and who else touches your data are all on one page rather than scattered through the product pages.
Everything in Portfolio.
Two halves of one product. Signals ends where a decision is needed; Renewals begins there.
Two hundred and forty-two API endpoints across the two halves · every row above ships today
Bring your hardest account.
We will pull up its health score and go through the components with you. Forty-five minutes on your data.